The early voting blog, Primary 2026

Update, 2 PM, Tuesday, June 9
Just a qucik mid-voting update:
The SOS posted an 11 AM tally, which shows Republicans doubling Democrats in turnout, but the numbers are still not robust overall (12,250 people). It's nowhere near 2-to-1 in Clark, but Washoe is and just look at those rural numbers! Eight and 10 times as many Republicans as Dems. MAGA country!
Some more mail came in and it's now almost even again among Dems and Repubs, with Dems a bit ahead, 136,500 to 135,000.
I'll update again later...
Update, 9:15 AM, Tuesday, June 9
Good Election Day morning, everyone.
The end of the beginning has arrived.
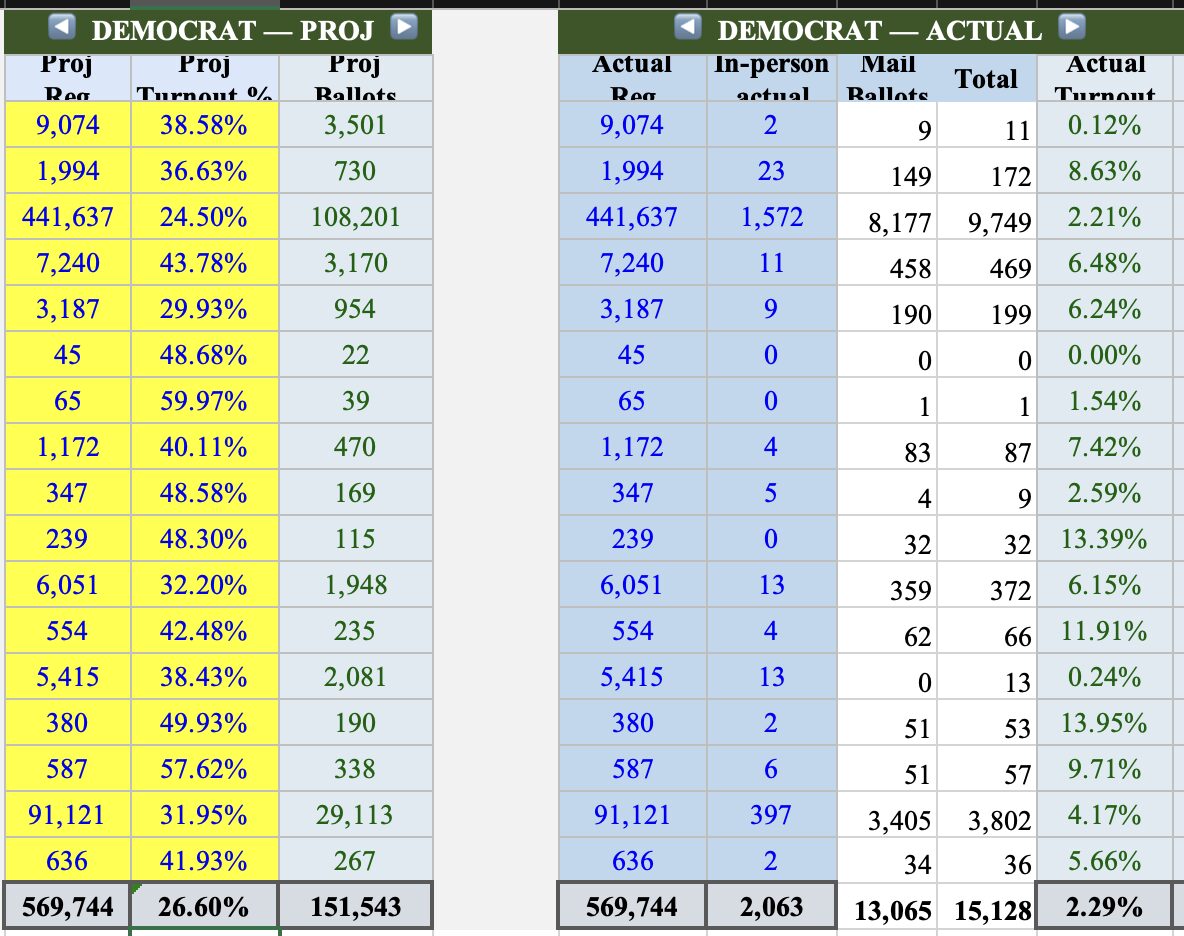
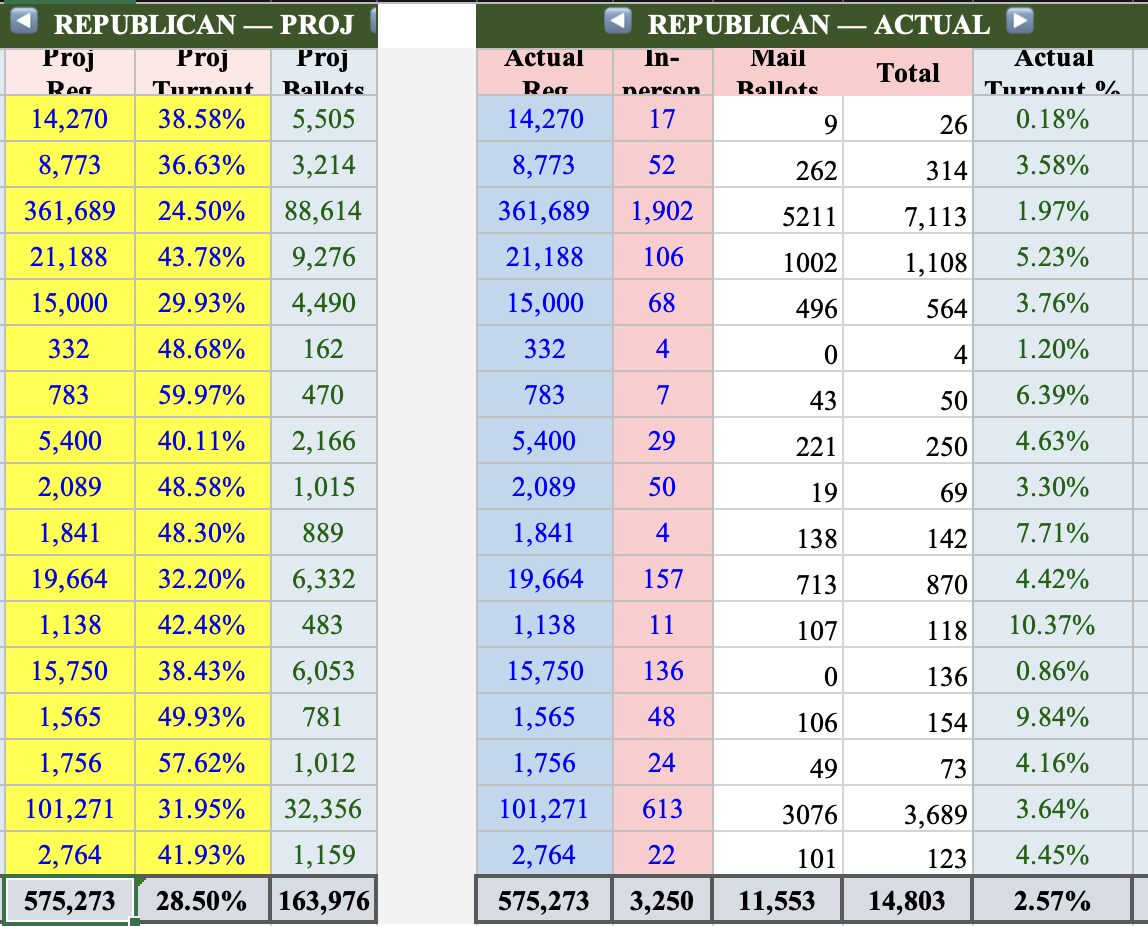
I will post the charts below, with one new column added to the actual totals for all voters, Dems and Repubs: How many votes are left in each county and overall.
I'll tell you what to look for tonight in a moment, but first the latest numbers, as usual per the SOS:
Total turnout going into Election Day was about 302,000 ballots, or under 15 percent.
Dems: 129,000, or 22.5 percent
Repubs: 125,000, or 22.6 percent
There are a lot of votes out there – a pool of 1.7 million and about 450,000 for each major party. But turnout is going to be very light today. Clark County has a live updating site with numbers – as I write this, of the 1.3 million left in Clark, 3,500 had voted in the first two hours. As I said: Very light.
So here's what to look for tonight:
Rs will outpace Ds in turnout today. Let's say it's 60-40, and the turnout today is a fifth of overall turnout for the primary. Right now, Dem and Repubs are about 85 percent of the total turnout. Let's say total turnout gets to 400,000 – that would mean about 100,000 today, which I think might be high, but it's a nice round number. (Some mail will come in Wednesday and very little thereafter).
If majors are 85 percent of that total, that means combined they are at 85,000. If Rs are 60 percent of that, we have 51,000 Rs and 34,000 Ds.
So totals would be approximately: 165,000 Ds and 175,000 Rs, not far from the model I have been telling you about. I'll let you know during the day what I am hearing, mostly on social media but I may post here, too.
So: In statewide races, an R candidate would need about 85,000 votes, assuming some for none of the above, and a D candidate would need about 80,000 votes.
In that hotly contested primary in CD2, where just over 50,000 have voted so far, the max it would get to if 20 percent of the remaking voters cast ballots, would be 80,000. I don't think it will get that high, probably closer to 65,000 or 70,000. So it's likely the favorite to be the next congressman in CD2 will only need 30,000 votes or so – maybe less! – to win. That is nuts.
I am going to post some new charts below so you can track how many votes are left in CDs and legislative districts -- some of these will be a little behind the mail counting but close enough. I have highlighted a few key legislative races. Many of these primaries will have a victor who garners just a few thousand votes, if that many.
I'll post the newer charts first, then the ones -- CDs, Senate and Assembly -- that show votes left by county. Enjoy, and you know where to find me.


Update, 1:15 PM, Monday, June 8
'Twas the day before Primary Day,
And all through the state,
Nary a creature was caring,
But the ads would not abate,
Most of the ballots had already been cast,
But somehow the suspense promised to last.
OK, OK, I'll stick to my day job.
Greetings, all. Fear not, it's almost over. Or will be tomorrow. Or the next day. Por the next day.
We're not California, but we do take our time.
A brief update before the big day:
A few thousand mail ballots have been added to the mix, leaving us with:
Dems are at 128,000 ballots, 72 percent of the mail, and 22.3 percent turnout.
Repubs are at 123,000 ballots, 59 percent mail, and 21.3 percent.
The adjusted model – if you recall I boosted the original upwards by 5 percent – shows Dems need 31,000 ballots added and Rs need just under 40,000. This seems very likely, perhaps still understated.
Remember, if the past was prologue, and it almost always is, 80 percent or so of the votes will have been cast before Tuesday, a significant amount of mail will be accepted Wednesday and then it will peter out.
Clark's turnout remains well behind Washoe and the rest of the state,. But because the largest county has so many voters, it still has 70 percent of the Dems voters and 53 percent of the Repub voters.
Data guru Paul Selberg reports that CD2 turnout on the GOP side – more than 50,000 votes – is by a huge factor much higher than any partisan turnout in the CDs – the closest is 35,000 in…CD2.
This is not that surprising because of the mayoral and congressional contests up there. But the numbers are striking.
The Indy team and I will be keeping an eye on all of the numbers tomorrow, so follow my reporters, too!
Get ready, and I promise no more doggerel!
The charts:


Update, 9:11 AM , Sunday, June 7
Hi, all. Just a quick update after a few thousand mail ballots added to the count. almost all from Clark and Washoe. Dems are just under 125,000 ballots and Rs just below 120,000.
Updated charts, and I have added mail/in-person ratios, so you can see just how dominant mail ballots are:


Update, 9:30 AM , Saturday, June 6
Good morning, my fellow data mavens.
The 14 days of joy are over! As you look at the numbers below, remember:
Mine may be different from yours or someone else's you trust, but mine are…correct. That is, they are the most up to date based on figures from the SOS.
Mail will continue to come in today and for a few days next week. Those totals will go up and Election Day will produce tens of thousands of new in-person votes.
Having said that, here's what we know:
Deme are at 84,789 mail ballots accepted and 35,678 in-person ballots – that's 120,467 total, or 21 percent.
Repubs are at 66,813 mail and 50,272 in-person – that's 117,085, or 20.3 percent.
I have told you – just look below! – that both parties would cross 20 percent by the end of the last day of early voting. The old man still has it!
The enhanced model shows 159,000 for Dems and 172,000 for Republicans. That still seems pretty reasonable.
Total turnout is just over 282,000 as I write this. That's 13.6 percent and means non-major-party turnout is about 45,000, or just 16 percent of overall turnout. That's how many people want to vote for judges and local, nonpartisan races in the primary.
In case you have forgotten, statewide primary turnout in 2024 was 19 percent while in 2022 it was 26 percent. It's at 13.6 percent right now. In 2024, after the in-person period ended, turnout was 12 percent.
Let's say both parties get close to 30 percent overall, which is possible, but Rs have a slight lead, which is likely because Election Day always favors the Rs:
30 percent for both: 172,000 ballots for both
25 percent for Ds and 30 percent for Rs: 172,000 for Rs and 144,000 for Ds.
It's going to be close to the model, folks. You are welcome.
The rest of the trends – Clark punching well below its weight, the other regions slightly above their reg – remain the same.
I may update these numbers later; I may not. It is Saturday, you know!
The charts:


Feel free to ping me with questions, errata, etc. I may even answer…
Update, 11:45 AM , Friday, June 5
Hello, are you still awake during this primary?
This is the last day, folks. Here's what we have through 13 days of in-person and mail – remember mail will continue to come in for a week, but will be a trickle by the end of next week:
These numbers will change during today, but my charts (below) show 106,000 ballots for Dems and 104,000 for Rs. They are both at 18 percent-plus. There will be larger turnout today as there always is at the end of in-person voting. I thought they would both be at 20 percent plus by the end of today, and they will be.
Mail continues to dominate, as you can see below. Clark turnout is going to get to 20 percent but not much beyond it. Some of the rurals may get close to 30 percent for both parties, especially the larger ones that matter: Lyon and Nye.
The overall turnout number – now at 12.3 percent – is relatively meaningless in primaries. And even the D and R numbers don't have much comparative value. Turnout is always low in Nevada primaries and will be this cycle, too.
My expanded model – 160,000 Ds and 172,000 Rs – may not be far off. Rs will lead because they will, unless something weird happens, blow out the Ds on Tuesday.
I don't care about non-major turnout in primaries, but if you are interested, it's about a fifth of total turnout, about 40,000 votes.
Here are the charts:


As always, if I made a data entry error or I'm being obtuse, you know where to reach me…
Update, 10:45 AM , Thursday, June 4
Hello, everyone. We are almost at the end!
Twelve days in, two more to go.
Overall turnout has finally eclipsed dingle digits, and partisan turnout is now above 16 percent for Dems and Repubs. As of this writing, as you can see from the chart below, Republicans have only 200 more ballots than the Democrats out of more than 180,000 cast among the major parties.
So the enthusiasm – or lack thereof – is almost identical among major party voters.
Clark has nearly 72 percent of the Dem primary voters, but that's well below it's nearly 80 percent of party reg. And Clark has only about half the GOP primary voters, more than 10 points below the actual reg. Clark is the only county where overall turnout is not yet in double digits, although it is for each of the parties.
I have updated the voter reg figures with new SOS numbers in the charts. It doesn't change much, and even with same-day registrants coming, the percentages won't be that much different.
So let's consider where we are: I still don't think either 2024 or 2022 are instructive – primaries are very dependent on which party has competitive races, and this year, both do, with GOP turnout in Washoe and the rurals the only obvious increase because of CD2 and the mayor's race.
For what it's worth, after early voting ended in 2022, Dems and Repubs were both under 20 percent, including mail. In 2024, the same was true.
So it's not much different this cycle, except with two more days, I think turnout for both parties will be at 20 percent-plus by the end of Friday. And mail will pour in over the weekend and Monday/Tuesday/Wednesday -- or at least trickle in. That's why I think the model with increased totals overall may be correct.
(Don't forget you can scroll down on this post to see all of the projections.)
Up to date charts:


As always, questions, corrections, brickbats and kudos can be sent to [email protected].
Update, 10:45 AM , Wednesday, June 3
Good morning, fellow data geeks.
It's really something how close the GOP and Dem totals have remained – it's now Rs, 81,855, and Ds, 81,091. That's just above 14 percent for each party.
What does that mean for my model, which I have not adjusted yet but still may: I (and Claude) projected 151,000 Ds and 164,000 Rs.
Let's suppose they get to 20 percent each by the end of the week. That would be about 100,000 ballots for each party, which seems reasonable. And if Election Day is a fifth of the turnout, but the GOP will have an advantage Tuesday, and with mail ballots still coming in and many will be cured, those numbers are within reach, perhaps even a little low. I also have a model with a 5 percent increase over the original model, which puts the totals at 159,000 for Ds and 172,000 for Rs.
Mail has changed everything, folks. So it's hard to tell, but I don't think the model will be that far off.
It's also something to see just how consistent the in-person turnout has been in every county. From Clark
Clark D: 1,585+919+994+1,614+1,656+1,598+1,888+1,701+1,056+1,815+1,974
Clark R: 1,909+1,038+1,072+1,874+2,012+1,998+2,548+1,874+1,075+2.066+2,049
Same in Washoe:
Washoe D: 397+194+205+383+383+444+423+335+257+378+549
Washoe R: 613+375+332+724+686+701+764+508+399+767+899
Even if the last day of in-person is large, as it always is, it won't change a lot, especially because mail ballots are so large a cohort for both parties.
I have talked about how small the numbers are overall that will decide races, but consider the totals in the three regions so far:
Clark: 122,000
Washoe: 42,000
Rurals: 32,000
Clark has coniderably more than the other 16 counties combined and Washoe has more than all of the other combined counties, not including Clark. The only harbinger here for the general is that the rurals are punching above their weight, and if GOP turnout is up there – and CD2 should make that happen – that ain't nothing if statewide races are close.
Here are the charts:


By the way, I will also update the voter reg totals once the SOS puts out the official ones for the end of May any day now.
More when I have it…
Update, 8 AM , Tuesday, June 2
Good morning to all of you interested in this primary — judging from the turnout, there are not a lot of you.
Only four days left including today in the early voting period, and while turnout may be slightly up from the past two cycles in raw numbers and Monday was a robust (everything is relative) for this cycle, turnout remains quite low.
Eric Neugoboren has a great chart showing the tick up from the last two cycles. But these are only affected by whether there were competitive and high-profile primaries in a given year. The CD2 race and the Reno mayor's race are juicing Washoe turnout, but Clark always has low turnout relative to the other 16 counties.
As I have been saying, there is nothing especially weird about the turnout patterns. But they are low enough that strange results would not surprise me, especially in down-ticket races but also in those primaries for AG.
Detailed numbers are below, but the pattern is the same: Dems and Repubs are turning out at about the same rate — 12.5 percent. Both are at about 70,000 ballots, with the Repubs ahead by about 1,000 as I write this. Remember my projections were for about 151,000 Dem ballots and 152000 D ballots and 164,000 R ballots. Miles to go, but in-person Election Day could make it close.
If you look at the raw numbers — 16,000 GOP ballots in Washoe so far — you can see just how small the number of votes will be to determine that CD2 race. (There are 15,000 on the Dem side.)
The numbers in Clark are low and embarrassing: When the Dems get 1,800 on Monday and the Repubs get 2,000 and those are large daily numbers for this cycle, you know how little interest people have.
Clark's turnout is 11 percent for both parties. The only county that is lower is tiny Esmeralda, which has zero mail ballots (!). Washoe turnout is 16 percent on both sides and half a dozen rural counties are above 20 percent.
But even at such a low relative percentage, Clark has 70 percent of the Dem votes and 54 percent of the R votes. Clark….matters.
On the GOP side, interesting to see the rural turnout just above Washoe. Does that bode well for David Flippo? Why are you asking me? Nobody knows nuthin'!
Here are the charts, folks:


As usual, please send comments, corrections and kudos to [email protected].
Update, 9 AM , Monday, June 1
Good morning, all.
Good news: It's almost over. Bad news: It's almost over.
No in-person voting on Sunday in the rurals, and very light turnout in the urbans – a combined 3,000 voters left their homes to vote in Clark and Washoe.
A few thousand mail ballots added to the mix in Clark and Washoe, so here are the totals going into Day 10:
Both parties have just under 64,000 ballots – in-person plus accepted mail – or a little more than 11 percent turnout. The overall turnout is not much different from 2024, so I think the model is going to be pretty close. It all depends on if Election Day is anomalous.
As data guru Paul Selberg points out, CD2 is driving a lot of the turnout – slightly more than one-third of primary voters are from Rep. Mark Amodei's open seat.
Clark turnout (about 10 percent for both parties) continues to lag behind most counties, in including Washoe (about 15 percent for both parties).
I continue to say nothing weird seems to be happening, but I do have this voice in the back of my head saying the CW could be wrong. That is, if the turnout is really this low, might there be upsets we don't see coming. Maybe.
That's why I don't do predictions in primaries!
Here are the numbers:


You can see how mail continues to dominate for both parties. It has totally changed the dynamic of Nevada elections.
More later…
Update, 10 AM , Sunday, May 31
Good morning, all.
We are in double-digits! In turnout for the parties, that is. Both are just over 60,000 ballots, as you can see from the charts below. That's just over 10 percent for both, with six days left including today.
There is no excitement at all, folks. Even though Saturday theoretically could have been a bigger day for in-person in the urban counties, it was not:
Clark: 1,701 D; 1,874 GOP
Washoe: 335 D; 508 GOP
Those are very low.
Mail ballots continue to dominate: 74 percent of D ballots and 61 percent of R ballots.
Clark turnout remains in single digits, with Washoe about 5 percentage points higher.
My (and Claude's) original projections were just over 150,000 for Dems, which would be 27 percent, and 164,000 for Repubs, which would be 29 percent. I still think that won't be far off, but 5 percent or so higher on both sides also seems possible.
The charts:


Until we meet again…
Update, 9:45 AM , Saturday, May 30
Good morning to all of you (do I need the fingers on both hands?) who care about this primary coming in 10 days, and welcome to the early voting blog.
One week in the books, and here's what we have:
Total turnout is 127,000, or 6.2 percent. Dem (51,500, or 9 percent) and GOP (53,000, or 9.2 percent) are significantly higher, with the total turnout brough down by the lack of nonpartisan turnout (as expected in a closed primary system).
Mail continues to dominate for both parties, with 75 percent of Dems voting by mail and 60 percent of Repubs.(Remember my totals count only mail that has been accepted, not returned.)
Both parties only have about a third of what the model says will be their total turnout, but if Election Day is a fifth of overall turnout and the second week of early voting exceeds the first, as it usually does, then they will hit those marks. No signs at all after a week that turnout will be especially low or high.
You can see from this chart that Washoe is punching well above its weight (Paul Selberg points out that CD2 is accounting for 37 percent of total ballots, surely because of all the attention on the GOP side):

And here are the other detailed numbers – I find it humorous or sad, not sure which, that no one noticed I previously had forgotten the county labels on these ones:


Just look at how low those Clark numbers are. It's really sad.
Questions, comments, errors? You know where to find me.
More later this weekend…
Update, 10:30 AM , Friday, May 29
IGood morning, fellow data geeks.
I'll have a full blog post up with charts, etc., later today or maybe in the AM, depending on how the day goes, but:
Not much has changed since last night's post yet: About 83,000 mail ballots accepted, just over 1,000 in-person ballots so far today, so 31,000 total. My guess is the majors will get close to 10 percent by the end of the day. Turnout could still get to 30 percent in each party as Rs and Ds are neck and neck.
A couple of interesting observations via data guru Paul Selberg, including:
---More votes have been cast in Clark than the other 16 combined, and it's not close: About 48,000 to 33,000.
----More NPs/Other ballots have been cast than Republican ballots in ADs 6 & 11. And more NPs/Other ballots have been cast than Democratic ballots in AD33.
More later…
Update, 3:45 PM, Thursday, May 28
Hello, everyone, and welcome back to the early voting blog.
These numbers – and the ones in the charts – are current as of 3:30 this afternoon, per SOS.
Total turnout, which I realize is becoming somewhat irrelevant because we really only care about partisan voters in a primary, is just under 107,000 ballots. That's 5.2 percent as Day 6 comes to a close.
Partisan turnout is a bit higher: Dems are at 43,500, or 7.6 percent; Rs are at 43,300, or 7.5 percent. So…about the same.
These numbers look very similar to 2024 at about the same time, maybe will tick upwards just a bit. I may adjust the model Claude and I built a bit, too, although I will wait for a full week of data. Right now, I have it at 150,000 Ds and 164,000 Rs. I think it might go higher. Not a lot higher, but higher.
Before I get to the standard charts, a few notes:
---Clark Dem turnout (6.9 percent) is well below Washoe (10.4 percent). A few of the rurals are already in double digits, but the numbers are still small because the number of Dems in rural Nevada is…small.
---Clark GOP turnout (6.5 percent) is also lower than Washoe (9.9 percent). A few rurals are in double digits on that side, too, as you will see below.
You can see the regional breakdowns relative to actual reg here:

----Mail continues to dominate: 73 percent of all ballots are mail. On the D side, it's 76 percent; on the R side, it's 63 percent. Sorry, POTUS, nearly two-thirds of Republicans like their mail ballots.
Here are the detailed charts:


Nothing really crazy seems evident – at least not yet. Let me know if you see otherwise, and please share your data, insight and corrections at [email protected].
Update, 8 PM, Wednesday, May 27
Just a quick evening update, folks:
Through 5 of the 14 days of early/mail voting, about 80,000 ballots have been cast, or 3.9 percent of the state's 2 million-plus voters. About 70 percent of ballots have been cast by mail. Both the Rs and Ds are at about 5.5 percent turnout.
Look upon these works...
Republicans outdistanced Democrats in in-person voting Wednesday, 3,600-2.200. Dems have 4,500 more mail ballots accepted than Rs. -- that lead essentially cancels out the similar lead Rs have in in-person voting.
Details, charts tomorrow. You know where to find me.
Update, 10:30 AM, Wednesday, May 27
Good morning, my fellow data devotees.
Charts coming below. Bottom line is no real anomalies to speak of, no sign this will be an unusually high or low turnout, with just under a third of the data in (4 of 14 days).
The toplines:
Overall turnout is 65,500 voters, or 3.2 percent. But I don't really care about non-major voter turnout that much for the primary – I will care about them a lot in November. The Dem turnout (4.7 percent) and Repub turnout (4.5 percent) are on track for what the model suggests, perhaps a little higher.
In 2024, about 59,000 voters had cast ballots through four days. But because the number of registered voters has increased, the percentage (3 percent) was not much different.
(One note: Some of the rurals are not fully updated and some, such as Nye, are showing 0 mail ballots accepted, which is…bizarre. Forget it, Jake; it's Nye County.)
Clark (2.7 percent) continues to have lower turnout than most counties, and Washoe is 2 percentage points above Clark (4.7 percent). Remember, we have CD2 and the mayor's race up there.
You can see the regional breakdowns here:

I don't try to draw any conclusions from primaries because the turnouts are so low, but I don't see anything so weird here that it would give some of the longshots and underdogs hope. This is a standard turnout pattern for a Nevada primary in the universal mail ballot era.
If you are wondering how much of the vote will be in before June 9, consider:
In 2024, Election Day turnout was about 18 percent of the total – so that means about four-fifths of the electorate had voted beforehand. Mail was about two-thirds of the total. Overall turnout was a measly 19 percent.
In 2022, when turnout was a bit higher at 26 percent, Election Day was a little more than 21 percent. So it's reasonable to assume that Election Day this year will be about a fifth of the total vote.
In 2024, a CD3 primary on the GOP side was about the only motivator for people, hence the very small turnout. In 2022, you had that spirited GOP primary for governor, which juiced turnout a bit. But still: 26 percent is…not good.
This year, besides those races in washoe, what's to attarct people to the polls? The AG's race? The race for SOS? I don't think so. alas.
It's really something that such a sliver of the electorate decides these races, some of which will set the general elections onto inevitable outcomes.
And as you can see in the charts, both parties love mail, despite what the president says:


As usual, hit me up with questions, comments, kudos and brickbats. or tell me where I have erred. I'm here for all of it at [email protected].
See you back here tonight...
Update, 9PM, Tuesday, May 26
Delayed by the Knights game, all, but a quick rundown -- I'll do the charts tomorrow:
No change in mail count, but in-person updated:
About 6,300 turned out in person Tuesday, 3,800 in Clark. Rs had big advantage today over Dems -- 3,570 to 2,195. Totals aftewr four days in-person voting: Just under 18,000 have voted -- 6,602 Dems and 9,733 Rs.
Nothing really anomalous yet -- looks a little bigger than 2024 turnout, which fits my model -- but I'll do a deeper dive, provide those charts you love, sometime tomorrow.
Go Knights!
Update, 12:45 PM, Tuesday, May 26
Quick midday update on day 4 of 14 of early voting:
Mail ballots now up to 43,000 accepted statewide -- 18,000 D and 14,500 R.
About 3,000 have turned out so far today in early voting.
The overall turnout -- mail and in-person -- is stil not up to 3 percent, although it may be by close of voting today.
For comparison: In 2024 after four days, turnout was at 3 percent statewide, and D turnout (4.4 percent) was slightly more than R turnout (4.2 percent). I don't think it's going to look a lot different this year. Look below for historical charts.
More later, with updated charts.
Update, 8 PM, Monday, May 25
Just a quick post on Memorial Day evening, folks:
2,300 people voted in Clark and 590 in Washoe – pretty even in Clark, Rs had 100 more than Dems in Washoe (CD2 could be a factor here).
I am re-upping the charts below to show statewide (2.4 percent) and for Dems (3.5 percent) and Rs (3.3 percent). Those totals include mail, which is overwhelmingly preferred by both parties – 78 percent of Dem turnout is mail and 68 percent of GOP turnout is by mail.
My projections (with Claude's help) of Dems at about 150,000 and Republicans at about 164,000 seems attainable – both under 30 percent. But still 11 days to go and lots of mail to come in, so it also could be higher. I'll let you know how it's trending.
I have also put together a chart (no need for Claude's help on this one!) to show how the turnout is going relative to registration in the three main areas of the state. You can see Washoe is trending almost double digits ahead of its registration on the Dem side, so that's possible good news for longshot Alexis Hill in the gov's race. (She's still a longshot, but let's keep an eye on these numbers.)
Washoe is also punching almost double digits ahead of its weight on the GOP side, which could help James Settelmeyer in his race against David Flippo. Maybe.
Here's that chart:

And here are the state, Dem and GOP totals:


Still very early, folks. If anyone has any data I might need, or criticisms I can bear, you know where to find me at this point…
Update, 10 AM, Monday, May 25
Happy Memorial Day, all.
Not much action on Sunday as the rural counties were not open for in-person early voting. I'll update the charts later, probably, but here's what we had through Sunday:
2,199 voted in Clark -- 1,038 were Republicans and 919 Dems.
620 voted in Washoe -- 375 were Republicans and 194 were Dems.
State in-person totals through Sunday: 1,413, GOP; 1,113, Dem. 2,819 is total, so Rs have half the voters so far in-person.
Mail through Sunday: Just under 38,000 accepted. 15,471 Dems; 12,904, Rs.
So about 41,000 through Sunday, which is about 2 percent of active voters.
Nothing unusual so far, folks. Going to be low turnout. If it gets to 30 percent, that would be high.
As usual, if you see errors or omissions, or have questions or comments, please let me know at @[email protected].
Update, 1:15 PM, Sunday, May 24
One day of numbers in, and not much unexpected so far. Remember there are 14 total days of early voting and mail ballots are pouring in, too. You can actually track the in-person early vote in real time in the urban counties here -- I have not included today's real-time numbers in the data sets below.
Just under 40,000 ballots are in -- 33,450 mail and 5,575 in-person. That's about 1.5 percent of active voters, so no sign of an anomalous primary turnout. It's going to be pretty low.
Of the total, Republicans and Democrats have about 15,000 total ballots each, or in the neighborhood of 2.5 percent. So no unusual enthusiasm on either side. (By the way, Republicans are overwhelmingly using mail ballots, as are Dems, so the Trumpian scare tactics have not worked. People like to vote by mail, irrespective of party.
As we expected, rural counties are running proportionally ahead of the urbans, although some rurals (Hello, Nye?) are behind.
So let's take a look at the granular numbers:
State totals

Dem totals
GOP totals
That's all for now. There are a lot of data points here, and neither Claude nor I are infallible, so if you see errors or omissions, please let me know at @[email protected].
Until I update again...
Update, 7: 10 PM, Saturday, May 23
Looks as if just under 3,800 voted in person in Clark on the first day, which compares to 3,500 two years ago and 5,500 in 2022. As expected, GOP turnout (1.895) is running ahead of Dem turnout (1,571). Just one day of data, so doesn't mean a lot.
In Washoe, where the GOP primary in CD2 has received a lot of attention, Repubs (613) far outpaced Dems (397).
Kudos to the SOS for having this posted so quickly.
----
Welcome to the early voting blog!
This biennial tradition to track Nevada ballot patterns begins today as voters flock to the polls — well, perhaps not flock in very large numbers because it is a primary in a midterm with not a lot to excite regular folks. (If you have any questions or corrections, criticisms or kudos, feel free to email me at [email protected]. I'm here for you.)
I will try to update this blog at least once daily, and perhaps more as events warrant. A cautionary note: This is not like a general election where I can tell with some accuracy what the partisan turnout patterns mean, sometimes even being able to declare races over before Election Day because so many Nevadans cast votes early, either in person or by mail. That will not be the case in a primary, where the most significant data point I will be watching is total turnout. The lower it is, the more likely strange stuff will happen and the base-worthy contenders will have a better chance.
For context, statewide primary turnout in 2024 was 19 percent while in 2022 it was 26 percent. Turnout also is dependent on whether there are high-profile races at the top of the ballot, and there really aren't any, especially because there is no Senate race this cycle in Nevada.
In the governor's race, the Democratic primary between Attorney General Aaron Ford and she-who-will-not-be-named-by-Ford (Washoe County Commissioner Alexis Hill, for the record) has not attracted much attention at all because Ford has not spent any money and Hill doesn't have much. Gov. Joe Lombardo and his allies have done their best to boost Ford's name ID with all the noise about the AG's global peregrinations.
It is hard to believe that the feisty and expensive Democratic AG primary will drive up turnout statewide that much from what it has traditionally been, although some local races may have a slight impact. One thing to watch is turnout in Washoe County, which could be higher than usual because of the 2nd Congressional District primary and the Reno's mayoral race. If it is really high, could that give Hill a chance for an upset? Probably not, but worth keeping an eye on it.
With the assistance of my new best friend, whose name is Claude, I have assembled historical turnout patterns and some projections for this year. You can see from this chart just how low Clark's turnout is compared to other counties, with Washoe a little higher and the rurals significantly above both urban counties ("M" is midterm, "Pres" is presidential year).

I have used these past totals to help project what 2026 will show, and my best guess (subject to change as votes are cast) is that between 150,000 and 180,000 ballots will be cast on each partisan side. (I am not that interested in nonpartisan turnout except to see just how low it is, despite the explosion in indie registration.) I think the Republican turnout will be slightly higher than Dems. But if not, I wouldn't extrapolate too much to the general election, which is a completely different animal. (That won't stop partisans from boasting about their sides' turnout and victory margins, but it's best to either ignore or mock those releases.)
Some other facts to remember:
— Sixty-three percent of the Republican voters are in Clark while 78 percent of Democratic voters are in the South.
— Mail turnout was 65 percent of the primary total in 2024, up from 57 percent in 2022. You can use this secretary of state link to track mail turnout, which shows 27,000 ballots already have been returned, or about 1 percent of active voters.
— The first and last days of early voting are usually the highest. We will know something from today's turnout what the trend is likely to be.
That's all for now. What interests you? What am I missing? Just ping me at [email protected].
Support Independent Elections Coverage and Journalism in Nevada
You’ve enjoyed unlimited access to our reporting because we’re committed to providing independent, accessible journalism for all Nevadans.
But sustaining this work — informing communities, holding leaders accountable, and strengthening civic life — depends on readers like you.
Nevada needs strong, independent journalism. Will you join us?
A gift of any amount helps keep our reporting free and accessible to everyone across our state and funds our elections coverage.
Choose an amount or learn more about membership