


Does NV have an unfunded pension problem? Depends on your math.

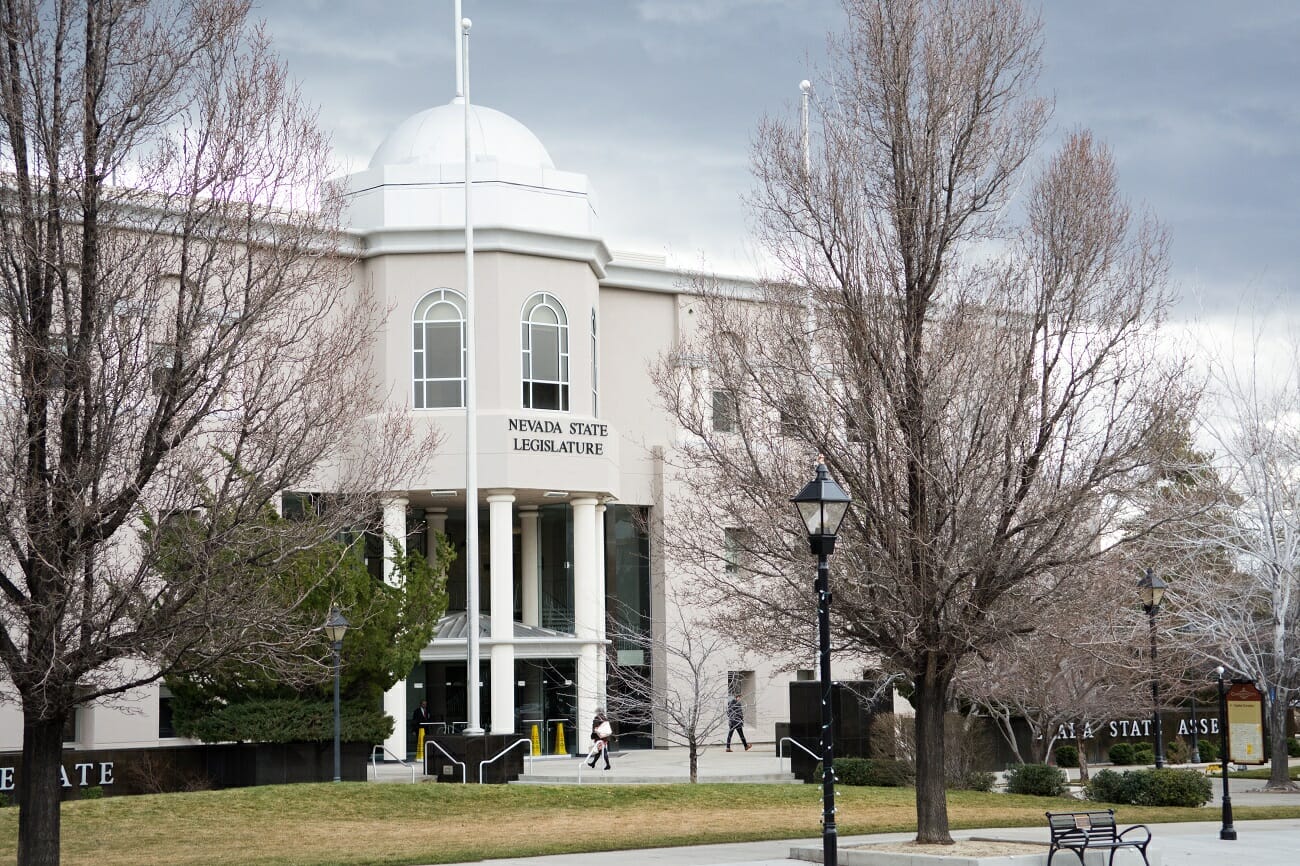
The Legislature has adjourned sine die, but the practical and political importance of the state's budget lives on. One perennial flashpoint: the state's unfunded pension liabilities, which often pit Democrats looking to keep the promises of today against Republicans looking to make cuts that balance the books in the future.
The good folks at Pew have done some extensive research into state fiscal trends, and recently took a deeper dive into state pension funding gaps. The national numbers are staggering and sobering: the gap between total pension assets and benefits promised to workers - net pension liability - reached $1.1 trillion in fiscal year 2015, the most recent year for which complete data are available. That represents an increase of $157 billion, or 17 percent from 2014, and plans dropped from being 75 percent funded to just 72 percent. Initial estimates for 2016 indicate the gap could expand by another $200 billion or 18 percent.
The largest contributing factor to the increases was a failure of investments to meet expected returns – pension plans assumed an average of 7.6 percent but got only 3.6 percent in 2015, and in 2016 the news was likely worse with gains averaging just 1 percent. On the flip side, investments generally outperformed expectations in 2014. Increased volatility is as a long-term challenge, and pension portfolio risk is on the rise – likely in search of higher returns that would reduce contribution needs.
Nevada Numbers
Pension health can be measured many ways. The most common and easiest to understand is what percent of the liabilities are currently funded, and whether that gap is increasing or decreasing. In this, Nevada came in at a respectable 23rd, roughly 75 percent funded for FY 2015. Despite a slide from 76 percent funded in 2014, Nevada gained from 24th in this measure and recent performance has generally exceeded the US average with better gains, narrower losses, and a higher funding ratio.
But market volatility can cause significant changes. Another metric used by state governments is "net amortization," which looks at whether a state's annual contributions are enough to reduce liabilities over time, based on long-term assumptions. Any state with consistently inadequate contributions will be in trouble, regardless of the market's ups and downs.
Thirty-two of 50 states had positive net amortization in FY 2015, but Nevada was not one of them. Our state came in as the eighth worst regarding insufficient contributions to meet liabilities, falling about 2 percent short of where we needed to as a share of payroll. This is an improvement from FY 2014, when we were sixth worst, but Nevada is clearly behind the national average when it comes to hitting contribution benchmarks.

Finally, let's look at Pew's Fiscal 50 for another, even broader evaluation of unfunded liabilities. There, pension liabilities, retiree health care costs, and state debt are calculated as a share of state personal income. On this measure, Nevada came in at 31st in the country at 14.6 percent in 2013, and is performing just above the national average of 14.8 percent thanks to low health care and general debt liabilities.
Conclusion
When it comes to making assessments against long-term projections, there are no easy answers. No single metric is more right or wrong than any other. Politicos may cherry pick the data that best suits their agenda and governing philosophy, but taking them all into consideration gives a more comprehensive and balanced view. Nevada is generally middling (pray for Illinois, which is failing on all three metrics). Nevada public policy makers don't need to freak out, but they should make sure they're carefully monitoring and preparing for corrective actions now, in order to avoid big problems down the line.
 John Restrepo, the author of this op-ed, is an economist and Principal of RCG Economics. He is an expert in regional economics and forecasting in Nevada and the Mountain West.
Disclosure: John Restrepo co-publishes the Stat Pack, a client of the communications consulting firm owned by The Nevada Independent's managing editor, Elizabeth Thompson.
Support Independent
Journalism in Nevada
The Nevada Independent is free to read, but not free to produce. A gift of any amount keeps our reporting open to every Nevadan and funds our coverage, powered by readers like you.
(Yes, you. Hi.)
Secure donation