Coronavirus Contextualized, 35th edition: Vaccinations continue at slow pace as cases again climb

Welcome to the 35th installment of "Coronavirus Contextualized," a recurring feature in which we explore some of the numbers swirling around in the time of coronavirus.
Through these stories, we hope to parse the numbers, including confirmed cases of COVID-19, people tested, number of hospitalizations and deaths, and provide some context to them. You can view the prior editions of "Coronavirus Contextualized" here on our coronavirus page.
These stories serve as a written roundup of the COVID-19 trends we kept our eyes on this week, with all graphs and charts living permanently on our COVID-19 data page, where they are updated multiple times a day with the latest numbers.
We're continuing to take suggestions for what kind of data, graphs and trends you would like to see analyzed in future versions of this story or included in a future update of our data page. Reach out to [email protected] with any feedback.
Below, we take a look at the latest COVID-19 trends as Nevada as the state continues its rollout of the vaccine and cases again are rising after a brief dip around the holidays.
Cases and test positivity
In the three weeks since our last edition of "Coronavirus Contextualized," the average number of new reported daily COVID-19 cases decreased and then started to increase once again.
Three weeks ago, the average number of new COVID-19 cases reported each day was 2,515. It decreased the next week to 2,224 and decreased even further the week after that to 1,787. However, as of Thursday, that number had bounced back to 2,281.
The record seven-day average, 2,736, was set on Dec. 10. The previous record from the summer surge was 1,176 on July 20.
Cases have been rising since mid-September, when a low of 267 cases on average were reported each day.
The situation, however, is worse in Clark County than it is in Washoe County, which was hit hard this fall by COVID-19. Washoe's record seven-day case average is 532, which it hit on Nov. 27. As of Thursday, its seven-day average was only 235. Compare that to Clark County, which peaked at 1,948 on Dec. 9, dipped to 1,352 on Dec. 31, and is now back to 1,916 as of Thursday.
Since the beginning of the pandemic in March, there have been 241,189 COVID-19 cases reported statewide. More than a quarter of those cases, 70,091, have been diagnosed in the last month, and 7 percent, or 15,964 cases, have been reported in the last week.
One in 13 Nevadans has tested positive for the virus since the beginning of the pandemic. Nevada ranks 19th in the nation for COVID-19 cases per capita, down from 17th three weeks ago.
Meanwhile, Nevada's test positivity rate — which looks at the percentage of tests or people coming back positive out of the total tested — also briefly dipped before starting to again increase. As usual, we'll look at two different methods of calculating test positivity below, using both individual people and a metric known as testing encounters.
Starting with the number of new reported people who tested positive for COVID-19 out of the total number of new reported people tested each day, the state's seven-day average test positivity rate was about 38.4 percent as of Thursday, down from a recent high of 45.9 percent on Dec. 13. The most recent low point, before the surge this fall, was 9.2 percent on Sept. 17.
One of the drawbacks, however, of looking at test positivity using individual people is that some people are tested repeatedly. Someone who tested negative four times but tested positive on their fifth time would be counted as a new positive person but not a new person tested. (In other words, they would be counted in the numerator but not the denominator.) That's why the test positivity rates calculated this way look so high.
Another way of looking at test positivity, as we have noted each week, is to examine test encounters, or the number of individual people tested each day. This method of looking at test positivity excludes duplicate samples collected the same day but accounts for people who are tested repeatedly on different days.
It is not possible to independently calculate the test positivity rate based on test encounters because the state only reports the number of positive cases, not the number of positive test encounters. However, the state does provide this number, calculated as an average over a 14-day period with a seven-day lag. As of Wednesday, that number was 20.6 percent, up from a recent dip to 19.6 on Dec. 31 but down from a recent high of 21.8 on Dec. 15. In September, before cases started to increase, the test positivity rate was 6.2 percent.
Whichever calculation you use to look at test positivity, the trends are generally the same. Test positivity had been increasing steadily since September, dipped a little bit in the last few weeks, and is once again going up.
Since the beginning of the pandemic, more than 1.2 million people — about one in 2.5 Nevadans — have been tested for COVID-19, and there have been almost 2.2 million individual testing encounters.
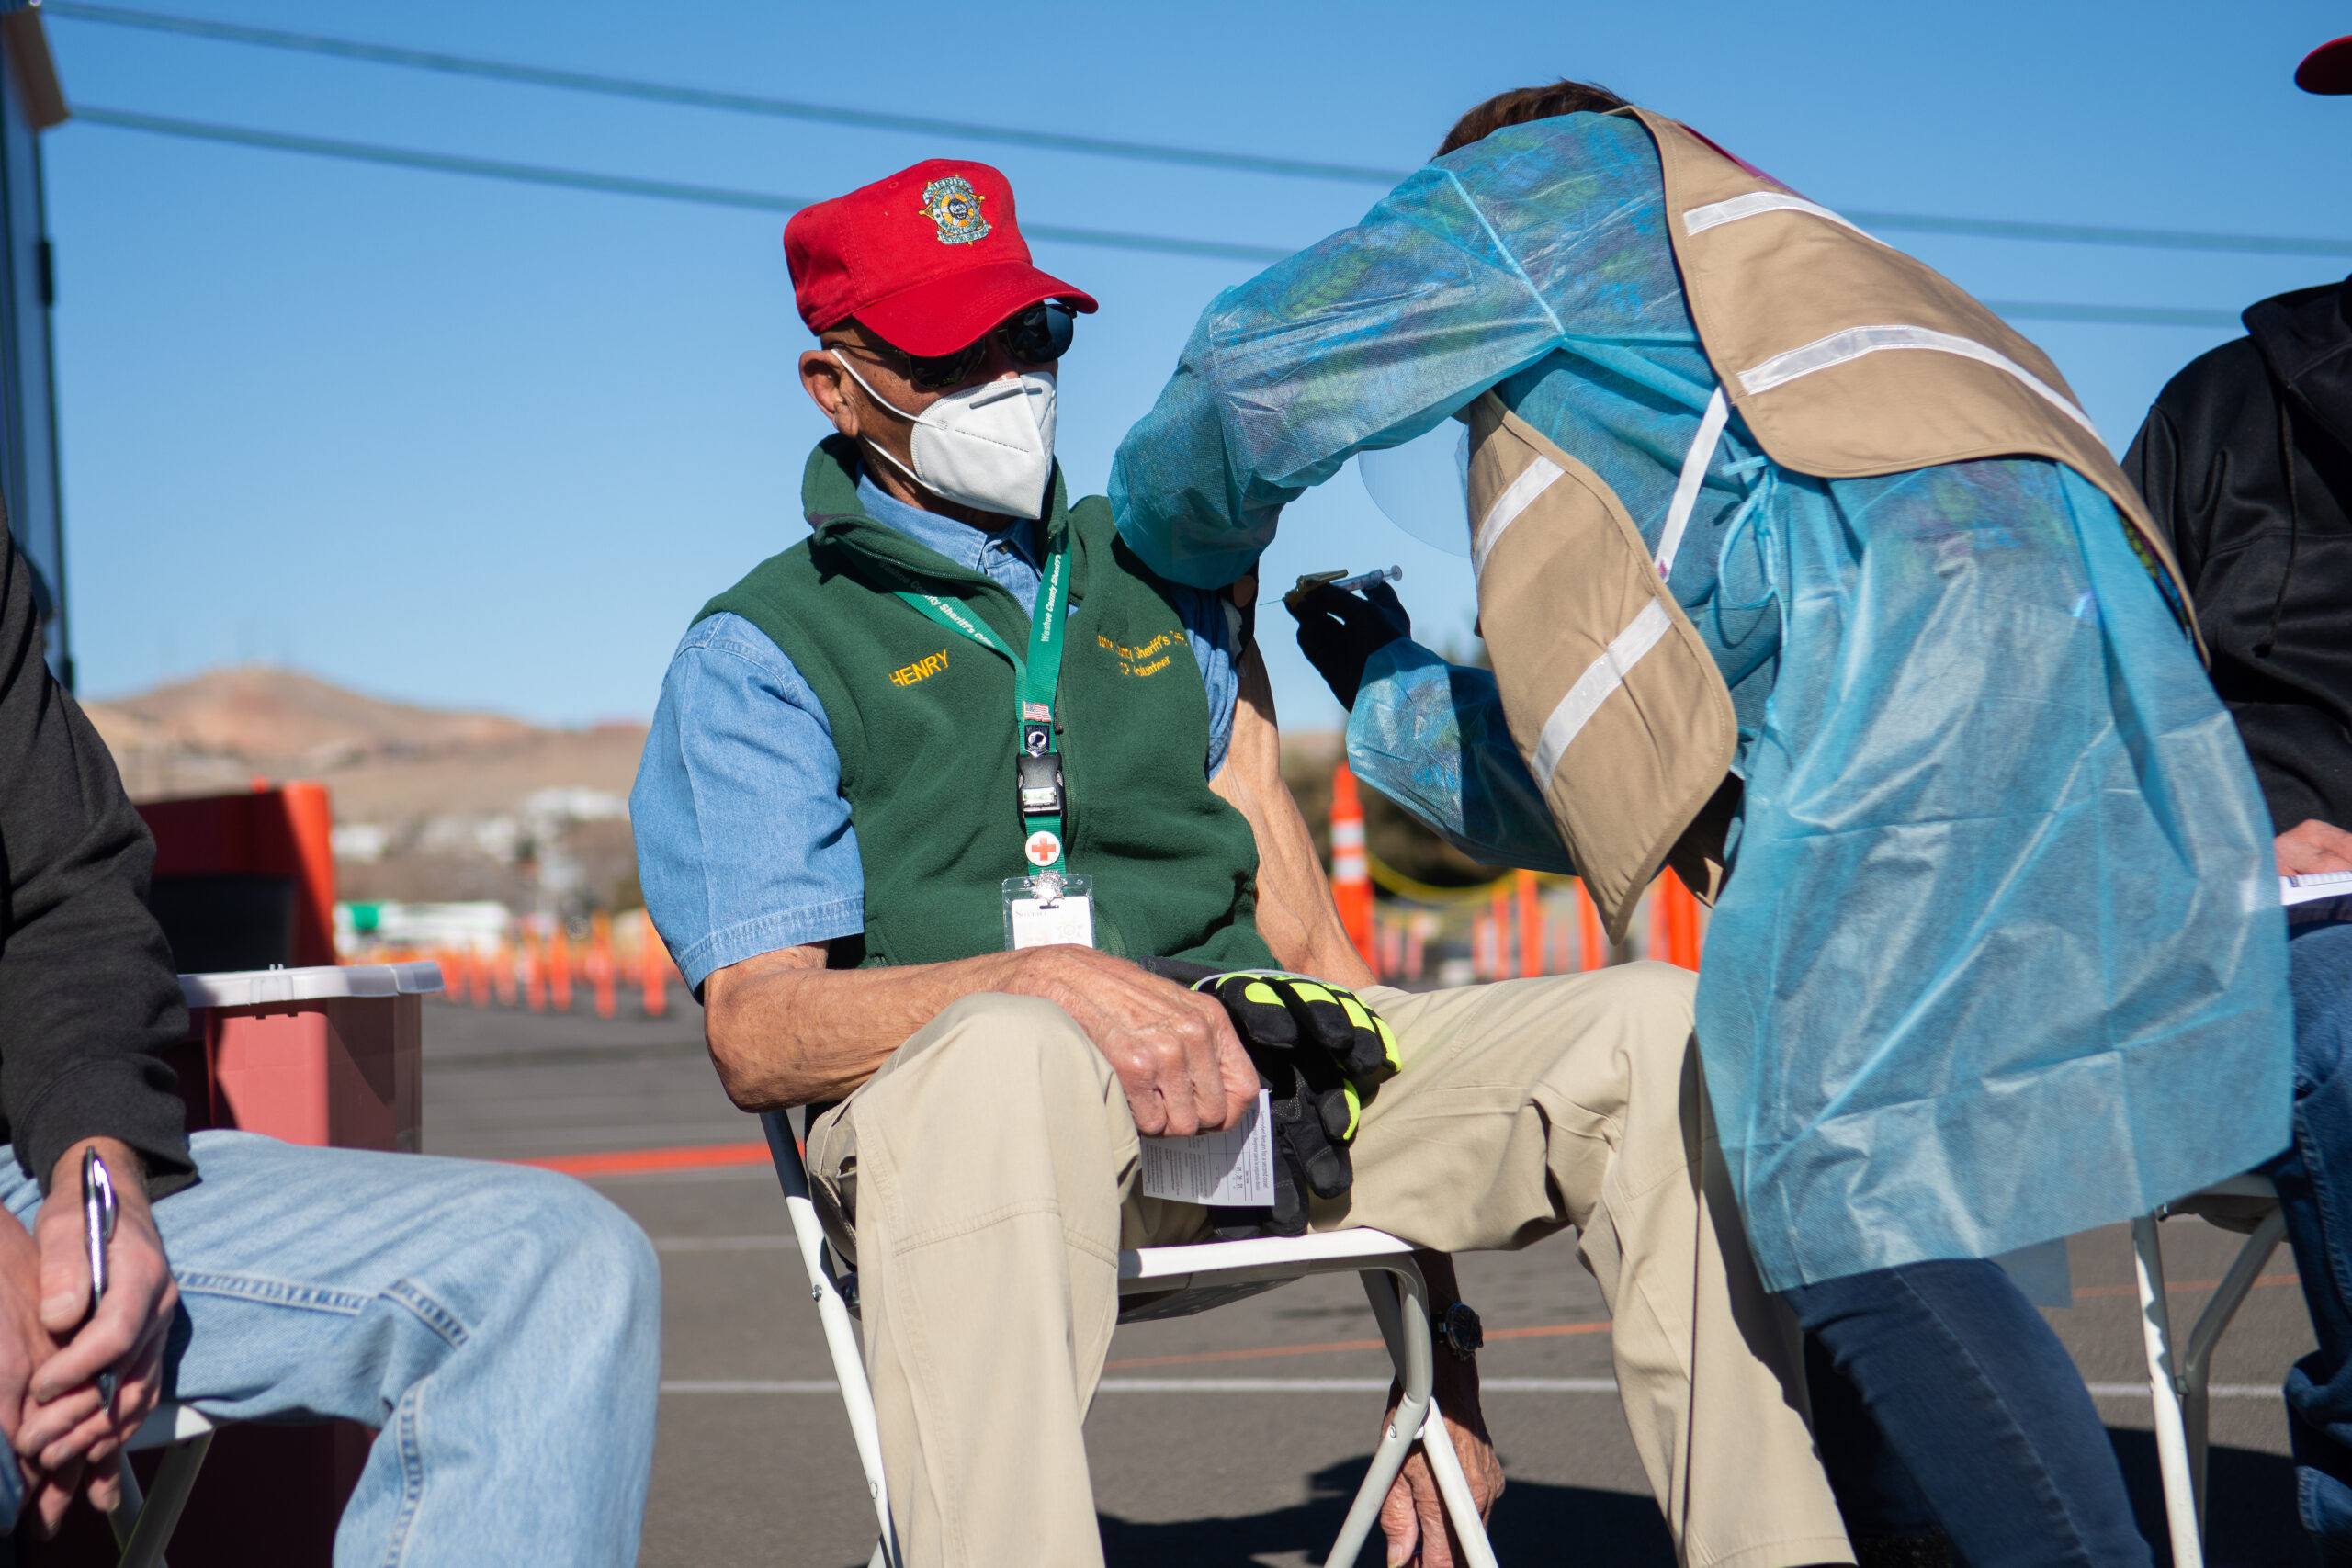
Vaccinations
Since vaccinations began in December, 39,761 people have received their first doses of the COVID-19 vaccine, according to the Centers for Disease Control and Prevention. In total, Nevada has received 187,375 doses of the COVID-19 vaccine.
This week, the Southern Nevada Health district reported that 21,081 COVID-19 vaccines have been administered in Clark County out of 70,050 total doses received. The health district was, as of this week, currently providing the COVID-19 vaccine to groups in "Tier 1" of the state's vaccination plan, including staff of smaller outpatient and home health facilities, as well as long-term care facility staff, psychiatric and behavioral health hospital staff, and laboratory staff.
The Washoe County Health District, meanwhile, reported that it individually has administered 6,634 COVID-19 vaccines through its Point of Dispensing, or POD, at the Reno-Sparks Livestock Events Center as of Thursday. The county as a whole has received 20,760 doses of the vaccine, including 8,370 doses allocated to the health district and 12,390 doses to community partners, including hospitals, emergency services providers and fire departments. Washoe County has said it will start administering vaccines to some K-12 personnel starting on Saturday.
In Carson City, officials reported they have administered more than 1,200 doses of the vaccine to health care workers, pharmacists and emergency operations personnel. They said that they plan to begin distributing the vaccine to Tier 2 individuals, including K-12, higher education and child care staff, starting Monday.
Carson City Health and Human Services manages vaccination operations in what are known as the Quad Counties — Carson City and Lyon, Douglas and Storey counties.
State officials have largely attributed the small numbers of vaccination numbers to lags associated with reporting into the state's vaccination database, known as WebIZ.
Deaths
Nevada hit a new record on Dec. 16, when 37.9 deaths were being reported on average each day. Since then, the seven-day average has fluctuated but remained high. Thursday's seven-day average was 30.1 deaths. The previous record over the summer was 20.7.
Over the last seven days, 211 new COVID-19 deaths have been reported across the state, including:
- 145 in Clark County
- 32 in Washoe County
- 17 in Carson City
- 5 each in Elko and Douglas counties
- 4 in Nye County
- 1 each in Lander, Lyon and Pershing counties
In the last month, 1,021 deaths from COVID-19 have been reported statewide, nearly a third of the 3,349 total COVID-19 deaths reported statewide since the beginning of the pandemic.
Churchill County still has the highest number of deaths per capita in Nevada, with 15.7 deaths per 10,000 residents, followed by Lander County at 14.5, Carson City at 13.2, Clark County at 11.1 and Washoe County at 11.
Nevada ranks 21st in the nation for deaths per capita, up from 23rd two weeks ago.
Hospitalizations
Nevada continues to see high levels of COVID-19 hospitalizations, though hospitalizations have generally plateaued.
There were 1,918 people hospitalized with COVID-19 as of Wednesday, the last day for which data is available, down from 1,975 three weeks ago. Hospitalizations peaked at 2,025 on Dec. 13, dwarfing the record set over the summer, 1,165.
"Nevada's COVID-19 hospitalizations continue to level off at the peak of the curve," the Nevada Hospital Association wrote in a report this week. "This has been providing the hospital infrastructure a much-needed reprieve and has kept hospitals and ICUs from being overwhelmed throughout the state."
Nevada now has the second highest number of people hospitalized with COVID-19 per capita at 62.3 per 100,000, behind Arizona at 67 and ahead of Alabama at 60.5 and California at 57.8.
Nevada hospitals are currently staffing 6,882 beds, more than the 6,660 they are normally licensed to operate, to keep up with the demand. As of Wednesday, 83 percent of staffed hospital beds and 74 percent of ICU beds were occupied. Those numbers were 85 percent and 81 percent, respectively, in Southern Nevada and 80 percent and 54 percent, respectively, in Northern Nevada.
"The northern area of the state continues to see significant declines in required hospitalizations, intensive care use, and necessary mechanical ventilator requirements," the hospital association wrote."
County by county
Sixteen of the state's 17 counties continue to meet the state's criteria to be flagged as at risk of elevated spread of COVID-19. Storey County remains the only exception.
Counties are considered at risk for elevated spread of COVID-19 if they meet two of the following three metrics:
- The average number of tests per day per 100,000, calculated over a 14-day period. If this number is less than 100, a county could be considered at risk.
- The case rate per 100,000, calculated by taking the number of cases diagnosed and reported over a 30-day period. If this number is greater than 200, a county could be considered at risk.
- The case rate per 100,000 and the test positivity rate, calculated over a 14-day period with a seven-day lag. If the case rate is greater than 50 and the test positivity rate is greater than 8.0 percent, a county could be considered at risk.
Pershing County continues to have the highest case rate in the state at 9,796 cases per 100,000 residents over the last 30 days, followed by White Pine County at 2,494 and Clark County at 2,094.
A spokeswoman for the Department of Health and Human Services said in an email on Monday that prison COVID-19 cases are driving the majority — more than 85 percent — of the cases in Pershing County at this time.
A state dashboard shows that 366 of the 840 total cases in Pershing County since the beginning of the pandemic have been identified through the Department of Corrections. That includes 291 inmates and 75 staff members.
Support Independent Elections Coverage and Journalism in Nevada
You’ve enjoyed unlimited access to our reporting because we’re committed to providing independent, accessible journalism for all Nevadans.
But sustaining this work — informing communities, holding leaders accountable, and strengthening civic life — depends on readers like you.
Nevada needs strong, independent journalism. Will you join us?
A gift of any amount helps keep our reporting free and accessible to everyone across our state and funds our elections coverage.
Choose an amount or learn more about membership