Coronavirus Contextualized, 36th edition: Cases remain high as officials anticipate more growth from holiday gatherings

Welcome to the 36th installment of “Coronavirus Contextualized,” a recurring feature in which we explore some of the numbers swirling around in the time of coronavirus.
Through these stories, we hope to parse the numbers, including confirmed cases of COVID-19, people tested, number of hospitalizations and deaths, and provide some context to them. You can view the prior editions of “Coronavirus Contextualized” here on our coronavirus page.
These stories serve as a written roundup of the COVID-19 trends we kept our eyes on this week, with all graphs and charts living permanently on our COVID-19 data page, where they are updated multiple times a day with the latest numbers.
We’re continuing to take suggestions for what kind of data, graphs and trends you would like to see analyzed in future versions of this story or included in a future update of our data page. Reach out to [email protected] with any feedback.
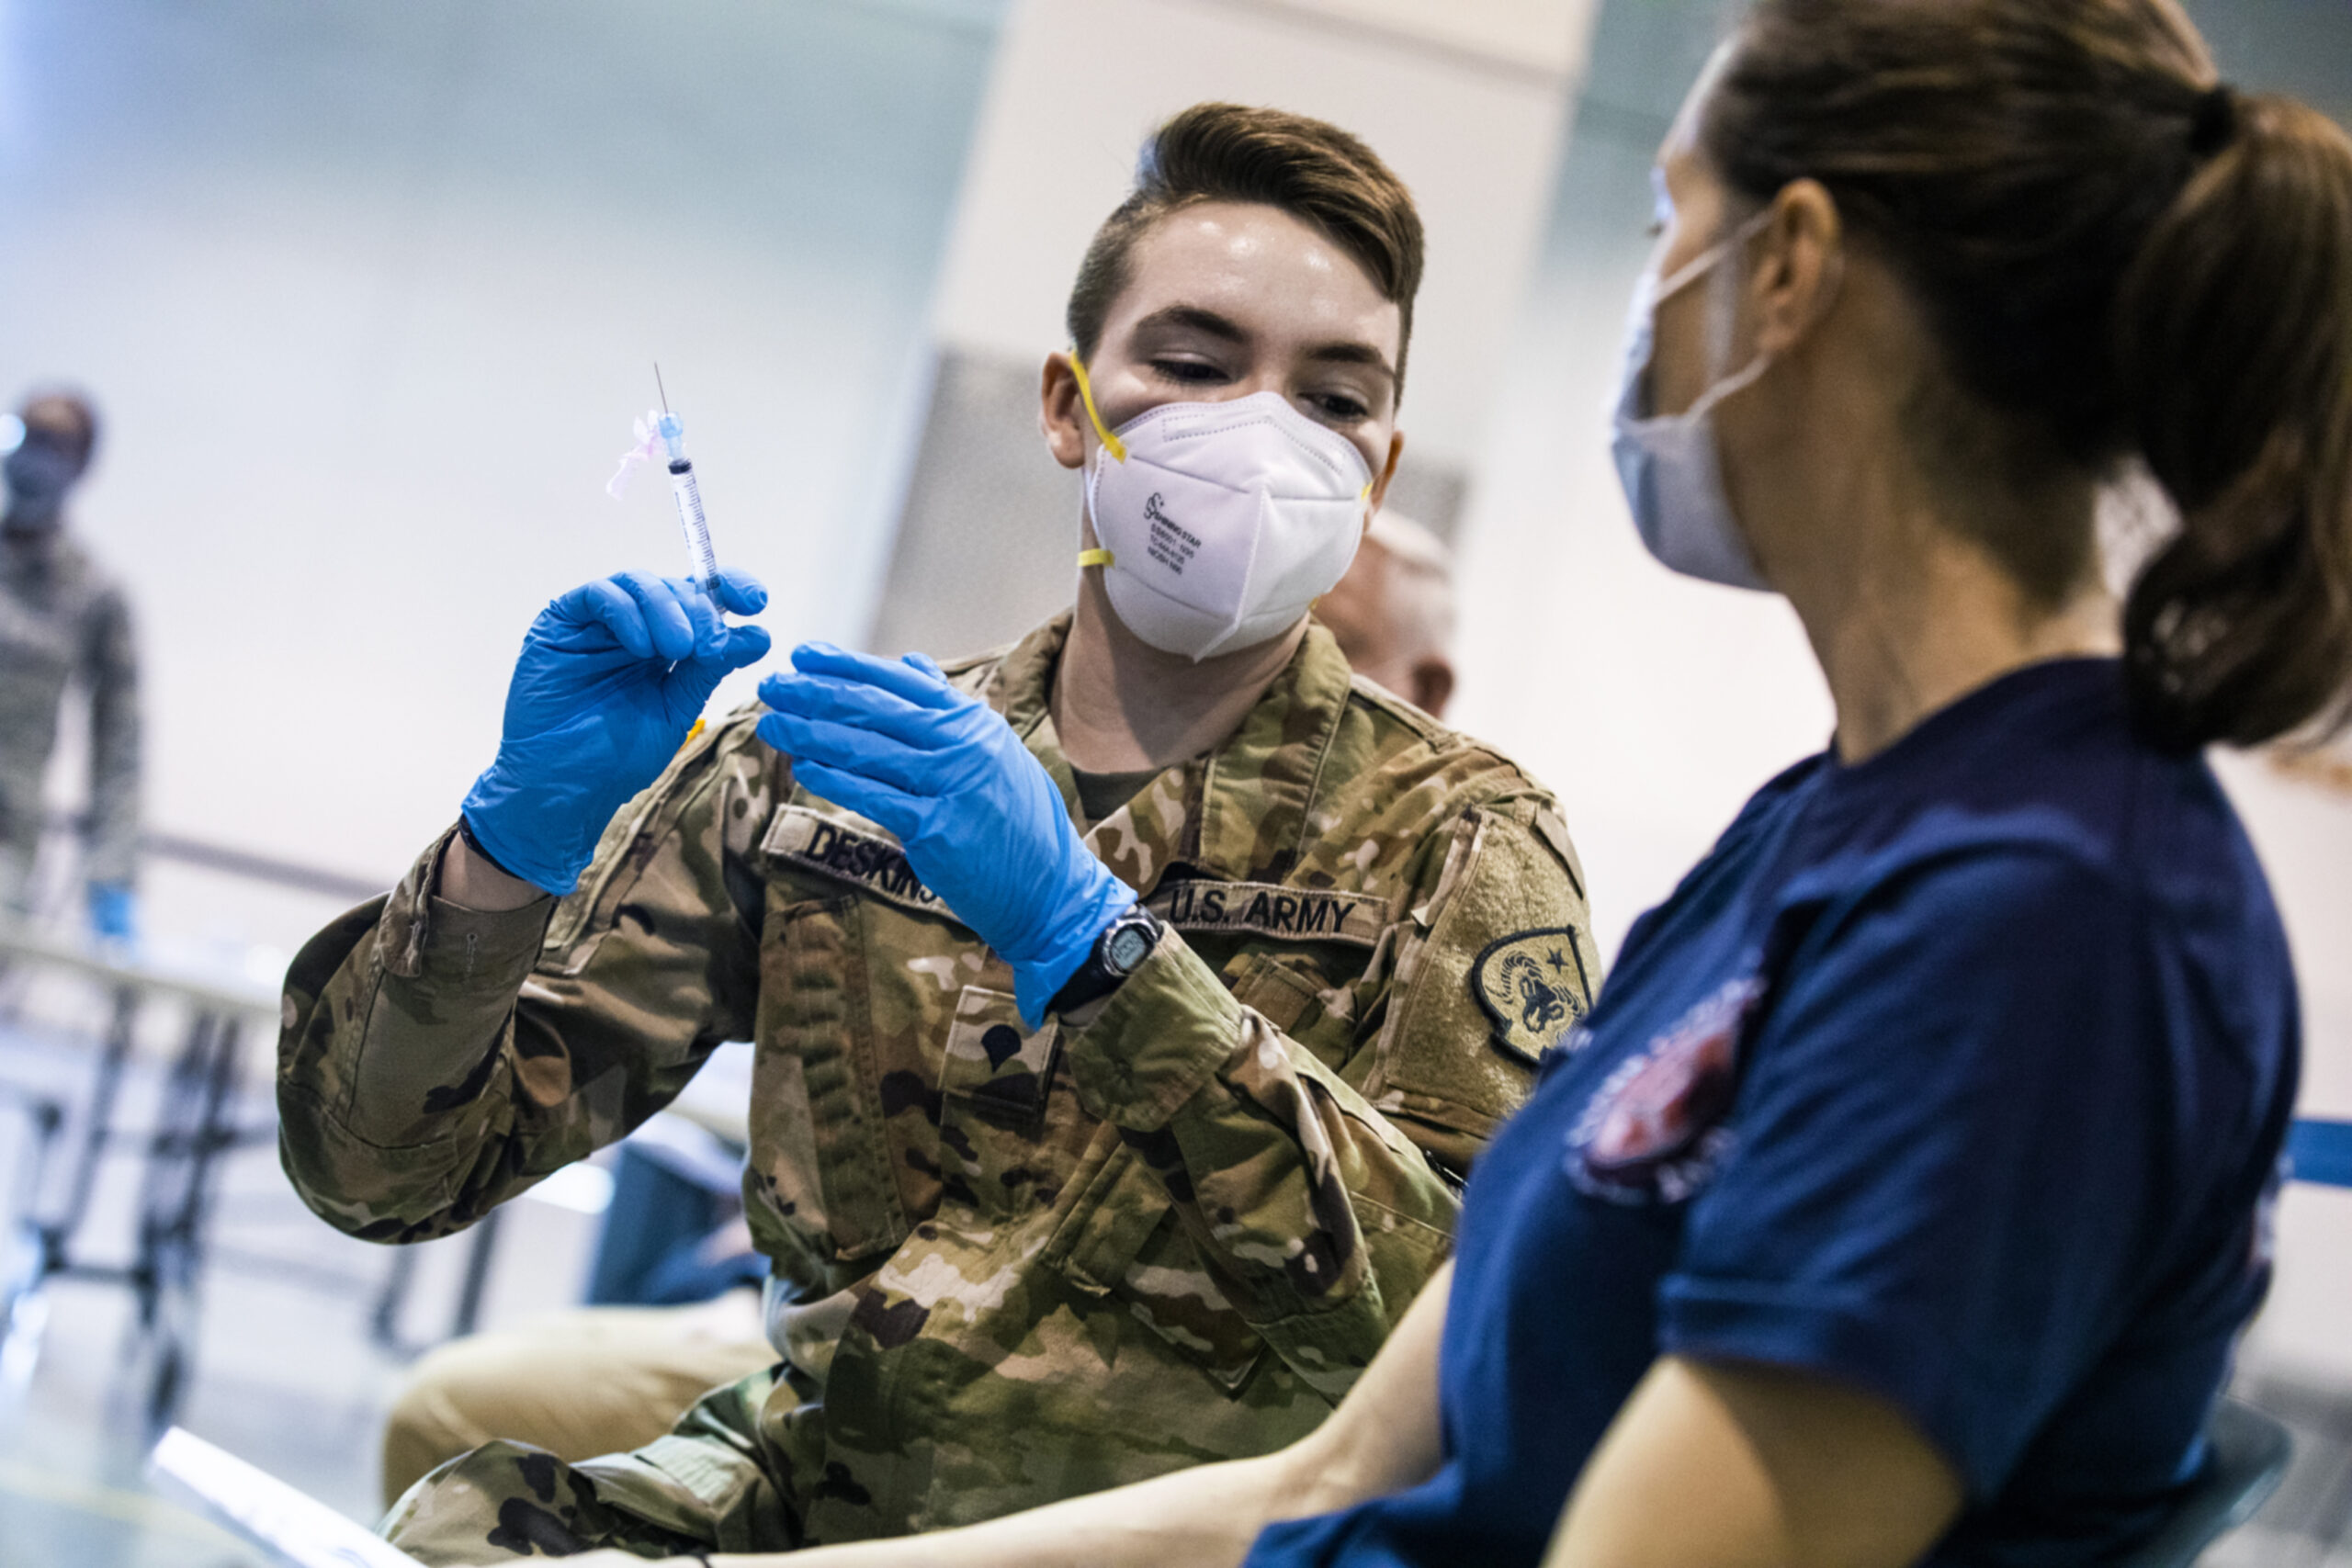
Below, we take a look at the latest COVID-19 trends as cases continue to rise and Nevada kicked off its rollout of the vaccine to those 70 and older this week.
Cases and test positivity
COVID-19 cases in Nevada remain high, though the last two days have seen some decreases, attributable at least in part to an unusually low number of cases reported in Clark County on Wednesday, which Southern Nevada Health District officials attributed to “delayed laboratory reporting.”
As of Thursday, an average of 2,182 cases had been reported each day over the last seven days, slightly down from both the recent peak of 2,500 on Tuesday and last week’s average, 2,285. The record seven-day average, 2,736, was set on Dec. 10. The previous record from the summer surge was 1,176 on July 20.
Cases statewide have remained high since mid-September, when a low of 267 cases on average were reported each day.
The situation continues to be worse in Clark County than it is in Washoe County, which was hit hard by COVID-19 late last year.
Clark County set a new record seven-day case average of 2,092 on Tuesday, with cases generally continuing to climb since a dip around the holidays. (It’s important to note that reported cases dipped statewide around both the Thanksgiving and December holidays, likely the result of slowdowns in testing and lab reporting.) Clark’s average was down to 1,812 on Thursday, dragged down by the unusually low number of cases reported on Wednesday.
Washoe County, meanwhile, remains significantly below a record average of 532 it hit on Nov. 27. As of Thursday, its seven-day average was only 220. The county has seen a slight bump in cases since a recent low point of 218 on Dec. 29 — hitting 248 twice in the span of a few days — but is nowhere near breaking its November record.
State officials have said that Nevada will likely not see the full impact of December holiday gatherings in the state’s COVID-19 case numbers until the end of the month.
Since the beginning of the pandemic in March, there have been 256,496 COVID-19 cases reported statewide. More than a quarter of those cases, 66,686, have been diagnosed in the last month, and 6 percent, or 15,277 cases, have been reported in the last week.
One in 12 Nevadans has tested positive for the virus since the beginning of the pandemic. Nevada ranks 17th in the nation for COVID-19 cases per capita, up from 19th last week.
At the same time, Nevada’s test positivity rate — which looks at the percentage of tests or people coming back positive out of the total tested — remains high. As usual, we’ll look at two different methods of calculating test positivity below, using both individual people and a metric known as testing encounters.
Starting with the number of new reported people who tested positive for COVID-19 out of the total number of new reported people tested each day, the state’s seven-day average test positivity rate was about 37.5 percent as of Thursday, down from a recent high of 45.9 percent on Dec. 13 but still significantly higher than the recent low point before the surge this fall, 9.2 percent on Sept. 17.
One of the drawbacks, however, of looking at test positivity using individual people is that some people are tested repeatedly. Someone who tested negative four times but tested positive on their fifth time would be counted as a new positive person but not a new person tested. (In other words, they would be counted in the numerator but not the denominator.) That’s why the test positivity rates calculated this way look so high.
Another way of looking at test positivity, as we have noted each week, is to examine test encounters, or the number of individual people tested each day. This method of looking at test positivity excludes duplicate samples collected the same day but accounts for people who are tested repeatedly on different days.
It is not possible to independently calculate the test positivity rate based on test encounters because the state only reports the number of positive cases, not the number of positive test encounters. However, the state does provide this number, calculated as an average over a 14-day period with a seven-day lag. As of Wednesday, that number was 21.6 percent, up from a recent dip to 19.5 on Dec. 30 and nearly back to the record 21.7 percent positivity rate on Dec. 15. In September, before cases started to increase, the test positivity rate was 6.2 percent.
Whichever calculation you use to look at test positivity, the trends are generally the same. Test positivity had been increasing steadily since September, dipped a little bit in the last few weeks, and is once again going up.
Since the beginning of the pandemic, about 1.3 million people — about one in 2.4 Nevadans — have been tested for COVID-19, and there have been almost 2.3 million individual testing encounters.
Vaccinations
Since vaccinations started in December, 76,844 people in Nevada have received their first dose of the COVID-19 vaccine — up 37,083 from last week, nearly double last week’s total — according to the Centers for Disease Control and Prevention. In total, Nevada has been distributed 210,075 doses of the vaccine.
At least 28,978 doses of the vaccine have been administered in Clark County, while the Washoe County Health District has individually administered 9,302 vaccines.
State officials have attributed the small numbers of vaccinations to lags associated with reporting into the state’s vaccination database, known as WebIZ. However, Clark County has experienced delays in getting the vaccine out to residents and is still administering vaccines to health care and public safety workers, even as other counties have started administering vaccines to K-12 employees.
A survey by UNR’s School of Medicine released this week that sampled 5,349 Nevadans between Nov. 25 and Dec. 31 found that 65 percent of people were likely to get the vaccine and 35 percent were unlikely. Among the various age groups, those 18-24 and 55 and older were most likely to say they would receive the vaccine.
White, Asian and non-Hispanic participants were most likely to say they would receive the vaccine (65 percent, 75 percent and 65 percent, respectively, were either “somewhat” or “very likely” to get it), while those who identify as American Indian, Hawaiian, African American or Black and Hispanic were generally less likely (58 percent, 60 percent, 42 percent and 58 percent, respectively). Those with chronic diseases were more likely to say they would receive the vaccine than those without chronic diseases.
The survey also found that each increased level of education correlates with at least a 5 percent increased likelihood of receiving the vaccine. Participants from urban counties were more likely to want to receive the vaccine than those from rural counties.
For more on the vaccination process in the state, read our vaccine Q&A here.
Deaths
Nevada continues to set new records day over day for the number of new deaths on average being reported. As of Thursday, 45 deaths were being reported on average each day over the last seven days, a new high, up from 30.1 last week. The previous record over the summer was 20.7.
The high numbers of new deaths being reported are not, however, unexpected given that trends in deaths tend to lag trends in cases by a few weeks.
Over the last seven days, 315 new COVID-19 deaths have been reported across the state, including:
- 238 in Clark County
- 38 in Washoe County
- 13 in Carson City
- 7 in Nye County
- 6 in Pershing County
- 5 in Churchill County
- 4 in Douglas County
- 2 in Lyon County
- 1 each in Elko and White Pine counties
In the last month, 1,105 deaths from COVID-19 have been reported statewide, nearly a third of the 3,664 total COVID-19 deaths reported statewide since the beginning of the pandemic.
Churchill County continues to have the highest number of deaths per capita in Nevada, with 17.7 deaths per 100,000 residents, followed by Carson City at 15.6, Lander County at 14.5, and Clark County at 12.2.
Nevada ranks 21st in the nation for deaths per capita, the same as last week.
Hospitalizations
Nevada continues to see high levels of COVID-19 hospitalizations statewide though the numbers have been trending down in recent days.
There were 1,746 people hospitalized with COVID-19 as of Wednesday, the last day for which data is available, down from 1,918 last week. Hospitalizations peaked at 2,025 on Dec. 13, dwarfing the record set over the summer, 1,165.
State officials, however, note that hospitalizations are likely to increase with cases again on the rise.
“It's important to understand that we have not seen the full impact of holiday transmission on our hospitalizations yet,” state biostatistician Kyra Morgan told members of the COVID-19 Mitigation and Management Task Force on Thursday. “We're actually anticipating that closer to the end of this month and the beginning of February is when we'll see the full impact related to holiday transmission and our hospitalization data.”
Individually, though, hospitals are being hit hard by the virus. Nevada hospital data from early January obtained by The Nevada Independent showed that 100 percent or more of inpatient beds were full in eight hospitals, including at Henderson Hospital, Valley Hospital, Renown Regional Medical Center and St. Rose Dominican Hospital, Siena Campus.
ICU beds were 100 percent full at seven hospitals, including Henderson Hospital, Valley Hospital, Sunrise Hospital, North Vista Hospital, Southern Hills Hospital and Spring Valley Hospital in Clark County and Humboldt General Hospital in Humboldt County. ICUs at another six hospitals were between 90 percent and 100 percent full.
While hospitals can transfer patients out to sister hospitals within their health system and facilities work together on a regional basis to balance out demand, the numbers show just how hard some Nevada hospitals have been hit by COVID this winter.
At eight hospitals, 50 percent or more of their inpatient beds were being taken up by COVID patients. Sixteen hospitals reported facing a critical staffing shortage.
The Nevada Hospital Association, in its report from Tuesday, noted only generally that “the southern region has multiple hospitals with elevated occupancy rates both within the wards and ICUs” and that “staffing remains a challenge at several hospitals.”
Nevada now has the third highest number of people hospitalized with COVID-19 per capita at 57.9 per 100,000, behind Arizona at 69.4 and Alabama at 60.7.
Nevada hospitals are currently staffing 6,954 beds, more than the 6,660 they are normally licensed to operate, to keep up with the demand. As of Wednesday, 81 percent of staffed hospital beds and 72 percent of ICU beds were occupied.
County by county
Fifteen of the state’s 17 counties continue to meet the state’s criteria to be flagged as at risk of elevated spread of COVID-19. White Pine County joined Storey County this week on the list of counties not at risk.
Counties are considered at risk for elevated spread of COVID-19 if they meet two of the following three metrics:
- The average number of tests per day per 100,000, calculated over a 14-day period. If this number is less than 100, a county could be considered at risk.
- The case rate per 100,000, calculated by taking the number of cases diagnosed and reported over a 30-day period. If this number is greater than 200, a county could be considered at risk.
- The case rate per 100,000 and the test positivity rate, calculated over a 14-day period with a seven-day lag. If the case rate is greater than 50 and the test positivity rate is greater than 8.0 percent, a county could be considered at risk.
Pershing County continues to have the highest case rate in the state at 7,685 cases per 100,000 residents over the last 30 days (driven in large part by an outbreak at Lovelock Correctional Center), followed by Clark County at 2,064 and White Pine County at 1,700. (Still, White Pine is not considered at risk because it wasn’t flagged under the test and test positivity metrics.)