Coronavirus Contextualized, 40th edition: Health officials urge vigilance as decreasing case numbers expected to plateau by March

Welcome to the 40th installment of "Coronavirus Contextualized," a recurring feature in which we explore some of the numbers swirling around in the time of coronavirus.
Through these stories, we hope to parse the numbers, including confirmed cases of COVID-19, people tested, number of hospitalizations and deaths, and provide some context to them. You can view the prior editions of "Coronavirus Contextualized" here on our coronavirus page.
These stories serve as a written roundup of the COVID-19 trends we kept our eyes on this week, with all graphs and charts living permanently on our COVID-19 data page, where they are updated multiple times a day with the latest numbers.
We're continuing to take suggestions for what kind of data, graphs and trends you would like to see analyzed in future versions of this story or included in a future update of our data page. Reach out to [email protected] with any feedback.
Below, we take a look at the latest COVID-19 trends as the number of new reported cases each day continues to decrease and as capacity restrictions on certain businesses started lifting this week.
Cases and test positivity
The number of new COVID-19 cases reported in Nevada continues to decline.
As of Thursday, an average of 492 cases were reported each day over the last seven days, down from 677 last week. At the peak of the surge this fall, the seven-day average was 2,736, on Dec. 10; the low point before cases started to increase in mid-September was 267.
State biostatistician Kyra Morgan, at a meeting of the state COVID-19 Mitigation and Management Task Force on Thursday, projected the state would hit a low of somewhere between 315 and 320 cases, similar to what was experienced at the end of the summer wave of cases, by the end of the month. However, she noted that at the last low point, in September, the state only saw those numbers stay low for about a two week period.
"When we rebounded from our summer wave, we really just had a very small period, a very short period of what I might call a sustained baseline before we started to see cases increase again and so just want everyone to exercise caution and continue to preface all of this progress with just the idea that we need to continue to be diligent," Morgan said. "If we see those numbers reach that baseline around March, just need to be really cautious that we're looking and making sure that we don't see subsequent increases that are significant just shortly thereafter."
Since the beginning of the pandemic in March, there have been 289,975 COVID-19 cases reported statewide. About 9 percent of those cases, 27,035, have been diagnosed in the last month, and a little less than 1 percent, or 3,442 cases, have been reported in the last week.
One in 11 Nevadans has tested positive for the virus since the beginning of the pandemic. Nevada ranks 16th in the nation for COVID-19 cases per capita, the same as last week.
Nevada's test positivity rate — which looks at the percentage of tests or people coming back positive out of the total tested — also continues to decline.
As usual, we'll look at two different methods of calculating test positivity below, using both individual people and a metric known as testing encounters.
Starting with the number of new reported people who tested positive for COVID-19 out of the total number of new reported people tested each day, the state's seven-day average test positivity rate was about 16.7 percent as of Thursday, down from a high of 45.9 percent on Dec. 13 but still significantly higher than the recent low point before the surge this fall, 9.2 percent on Sept. 17.
One of the drawbacks, however, of looking at test positivity using individual people is that some people are tested repeatedly. Someone who tested negative four times but tested positive on their fifth time would be counted as a new positive person but not a new person tested. (In other words, they would be counted in the numerator but not the denominator.) That's why the test positivity rates calculated this way look so high.
Another way of looking at test positivity, as we have noted each week, is to examine test encounters, or the number of individual people tested each day. This method of looking at test positivity excludes duplicate samples collected the same day but accounts for people who are tested repeatedly on different days.
It is not possible to independently calculate the test positivity rate based on test encounters because the state only reports the number of positive cases, not the number of positive test encounters. However, the state does provide this number, calculated as an average over a 14-day period with a seven-day lag. As of Wednesday, that number was 11.3 percent, down from a high of 21.7 percent on Jan. 13. In September, before cases started to increase, the test positivity rate was 6.1 percent — meaning that test positivity is still nearly double what it once was.
Whichever method you use, the trend is still the same: Statewide test positivity continues to be on the decline.
Since the beginning of the pandemic, about 1.4 million people — about one in 2.2 Nevadans — have been tested for COVID-19, and there have been more than 2.6 million individual testing encounters.
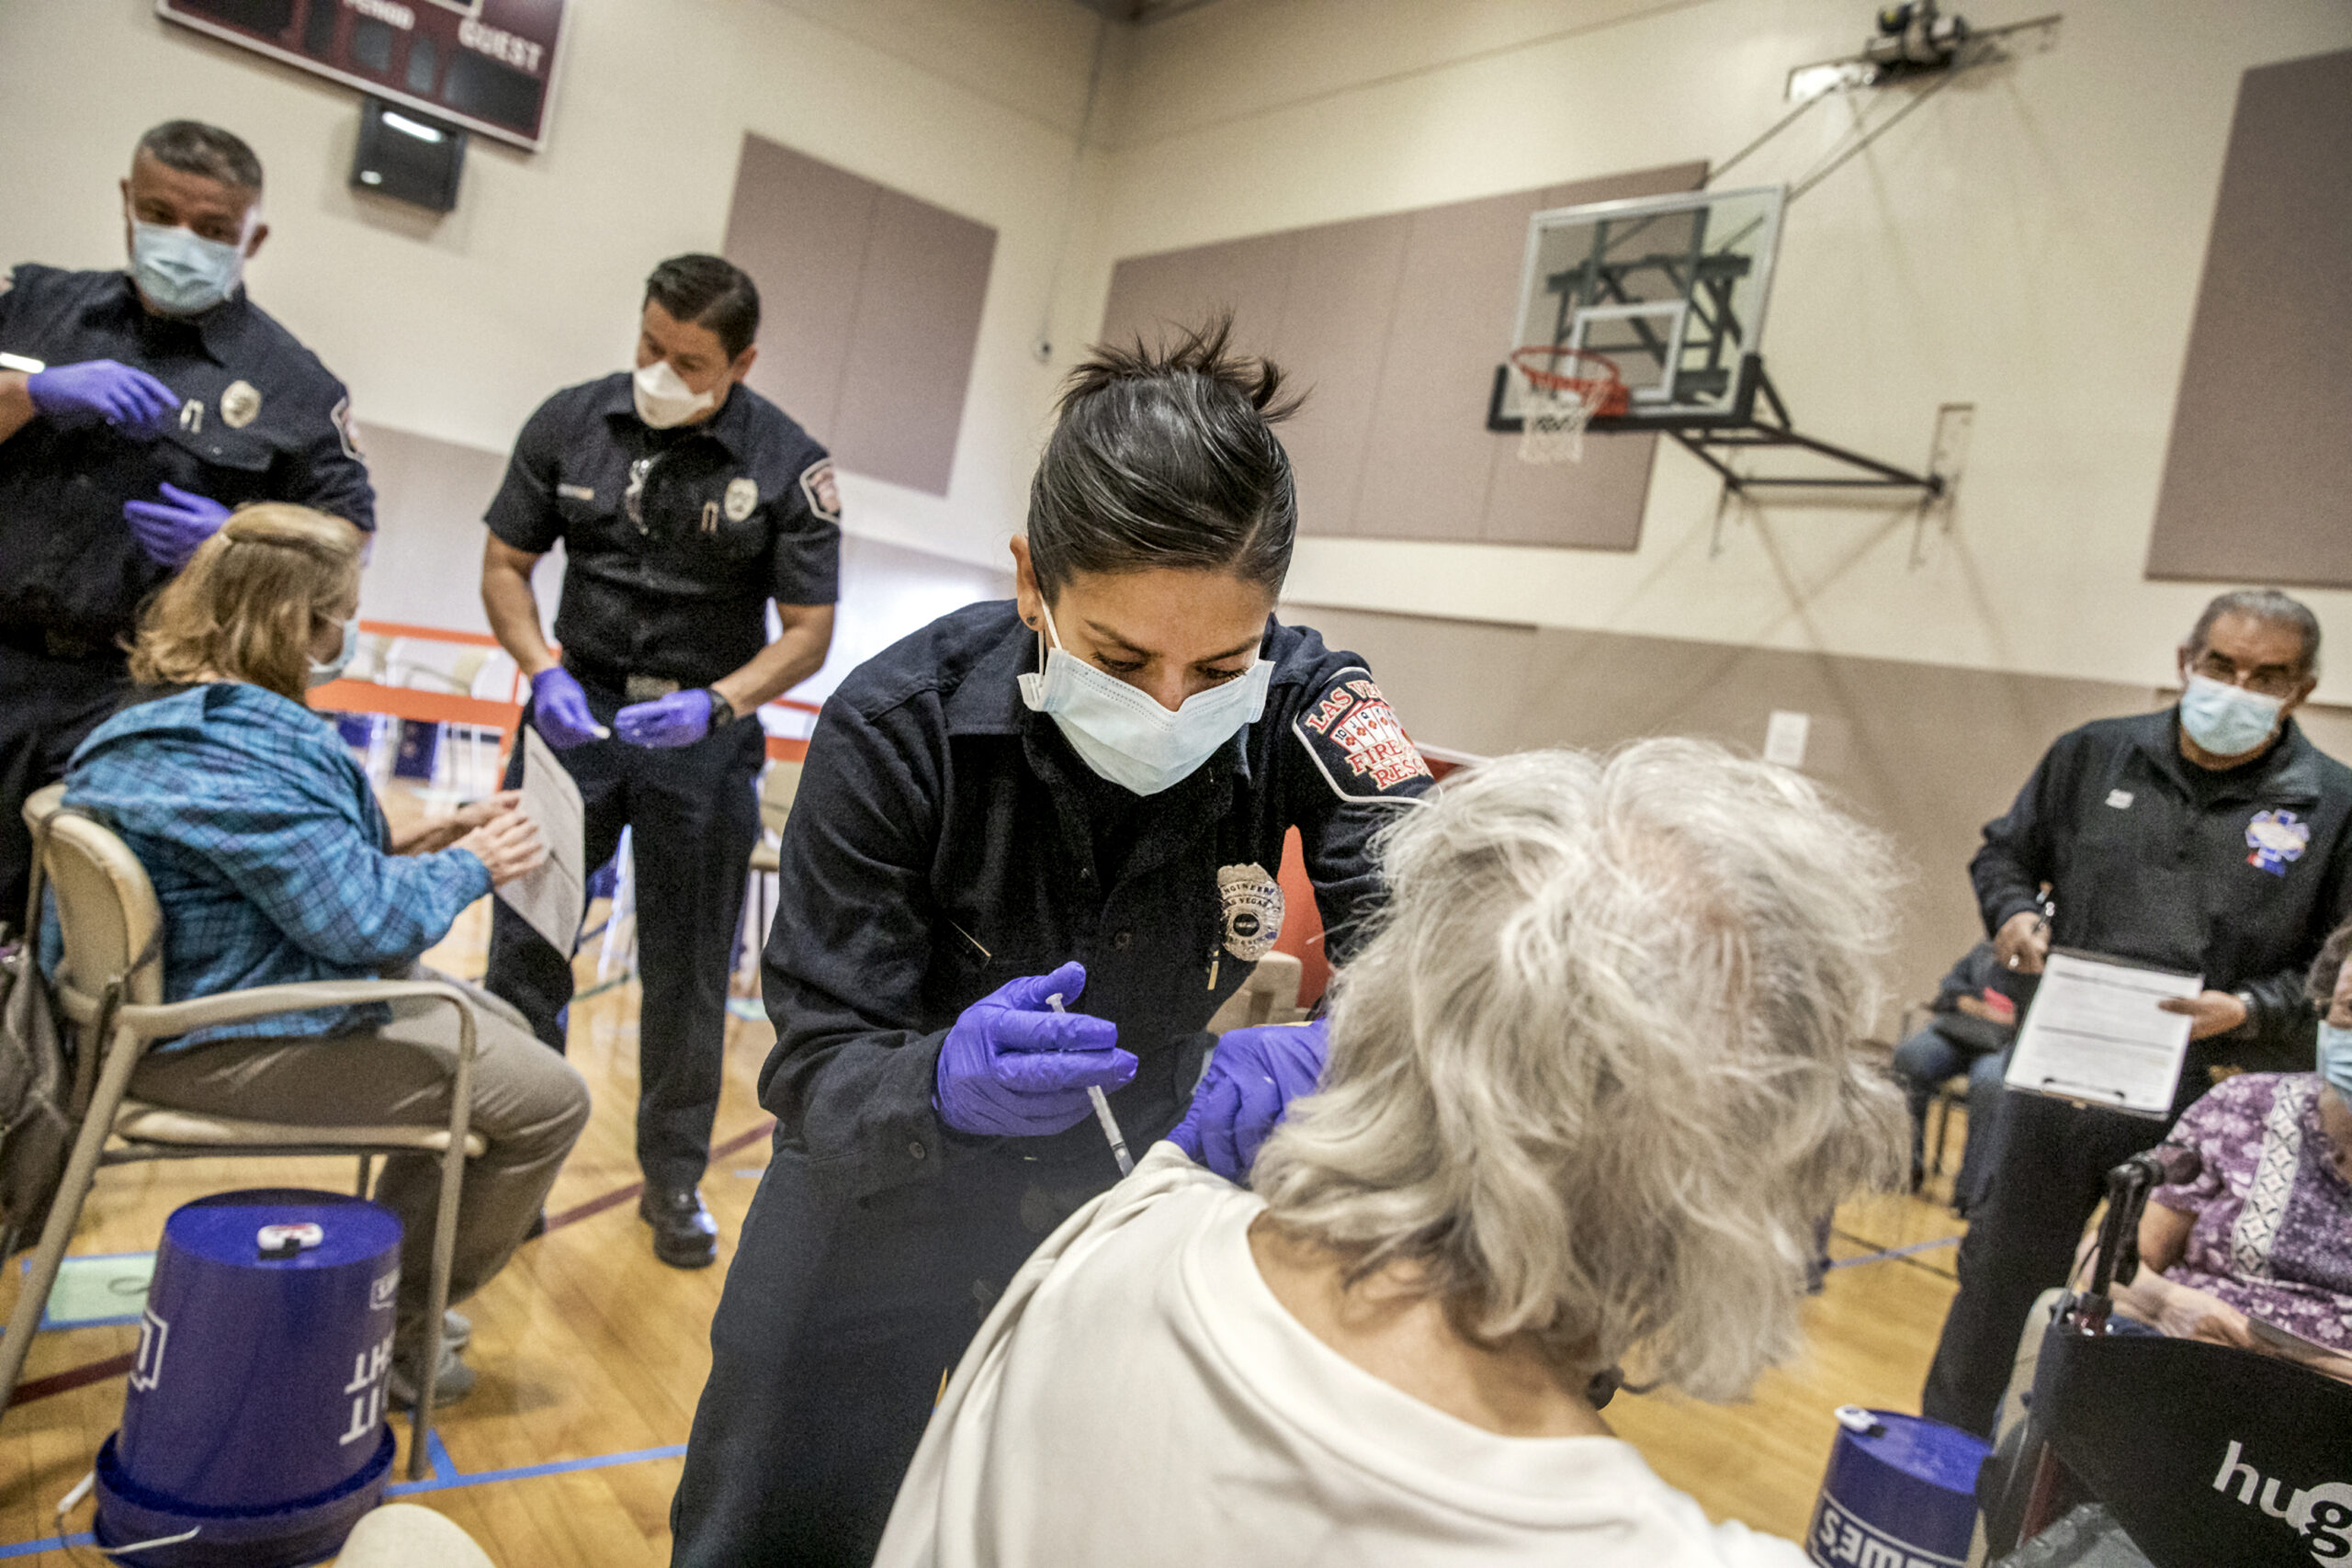
Vaccinations
Since vaccinations started in December, 466,981 doses of the COVID-19 vaccine have been administered in Nevada, according to the Centers for Disease Control and Prevention. That includes 346,585 first doses and 118,192 second doses.
That means that one in nine Nevadans has either been fully or partially vaccinated. In total, Nevada has been distributed 593,275 doses of the vaccine by the federal government.
According to the CDC, Nevada is now receiving the sixth fewest number of doses per capita from the federal government of any state — up from third last week — at 19,261 per 100,000 residents. It is still unclear what formula the federal government is using to allocate vaccines to states and why Nevada is receiving fewer than other states on a population basis.
Nevada has administered the 10th fewest doses per capita of any state, the same rank as last week. The state, however, falls around the middle of the pack, 22nd fewest, for doses administered as a percentage of doses received at 78.7 percent. That percentage is, however, up from 68.7 percent of doses administered last week.
Among the counties, Mineral County has administered the most doses per capita, at 38,047 vaccines administered per 100,000 residents, followed by White Pine at 30,481 and Eureka at 19,271. Clark County continues to rank 9th at 11,142, while Washoe still ranks fifth at 15,998.
It's important to note that these numbers are a rough approximation, as shots are reported based on the county where they were administered, not where the person they were given to lives.
For more on the vaccination process in the state, read our vaccine Q&A here.
Deaths
The number of new COVID-19 deaths being reported each day is decreasing, though they remain at a still-high level.
As of Thursday, 24 deaths were being reported on average each day over the last seven days, down from a high of 45 on Jan. 14. Over the last seven days, 167 new COVID-19 deaths have been reported across the state, including:
- 147 in Clark County
- 10 in Washoe County
- 4 in Douglas County
- 3 in Nye County
- 2 in Elko County
- 1 in Carson City
In the last month, 1,022 deaths from COVID-19 have been reported statewide, a fifth of the 4,807 total COVID-19 deaths reported statewide since the beginning of the pandemic.
Pershing County still has the highest number of deaths per capita in Nevada, with 30 deaths per 10,000 residents, followed by Carson City, Churchill County and Nye County, each at 20.
Nevada ranks 21st in the nation for deaths per capita, the same as last week.
Hospitalizations
COVID-19 hospitalizations in Nevada continue to decline.
There were 698 people hospitalized with COVID-19 as of Wednesday, the last day for which data is available, down from 879 last week. The record, 2,025 hospitalizations, was set on Dec. 13. The low point in September was 417.
Nevada still has the sixth highest number of people hospitalized with COVID-19 per capita at 24.5 per 100,000, behind New York, Georgia, Arizona, New Jersey and Texas.
Nevada hospitals are currently staffing 7,013 beds, more than the 6,660 they are normally licensed to operate, to keep up with the demand. As of Wednesday, 73 percent of staffed hospital beds and 63 percent of ICU beds were occupied. Those numbers were 77 percent and 68 percent, respectively, in Southern Nevada and 69 percent and 48 percent in Northern Nevada.
County by county
Eight of the state's 17 counties are considered at elevated risk for the spread of COVID-19 according to state criteria as of Thursday. Those counties are Clark, Elko, Eureka, Lincoln, Mineral, Nye, Pershing and Washoe.
Counties are considered at risk for elevated spread of COVID-19 if they meet two of the following three metrics:
- The average number of tests per day per 100,000, calculated over a 14-day period. If this number is less than 100, a county could be considered at risk.
- The case rate per 100,000, calculated by taking the number of cases diagnosed and reported over a 30-day period. If this number is greater than 200, a county could be considered at risk.
- The case rate per 100,000 and the test positivity rate, calculated over a 14-day period with a seven-day lag. If the case rate is greater than 50 and the test positivity rate is greater than 8.0 percent, a county could be considered at risk.
There is, however, some talk of the COVID-19 Mitigation and Management Task Force changing these metrics as the vaccination campaign continues and in light of the fact that COVID-19 may become endemic, essentially permanent, like the flu or the common cold.
Morgan, the state biostatistician, noted that the case rate threshold is at 200 but Nevada hasn't achieved 200 cases a day since the state's stay-at-home order in March.
"When we look at the criteria for elevated disease transmission, we need to give ourselves the flexibility to understand what a reasonable baseline is and we've learned a lot now compared to what we knew when we came up with that criteria," Morgan said. "I do think we need to just have a fluid conversation around what is a realistic benchline, so that we're setting goals that are achievable — and still work to keep infrastructure and things like that under control — but so that we just aren't consistently flagging everyone for a goal that's essentially not ever going to be maintained."
Mineral County continues to have the highest case rate in the state at 1,491 cases per 100,000 residents in the last 30 days. Clark County comes in second at 811 and Pershing County comes in third at 575.
Update 2/25/20: This article has been corrected to omit a missing word. Pershing County has the highest death rate per capita of any county in Nevada.
Support Independent Elections Coverage and Journalism in Nevada
You’ve enjoyed unlimited access to our reporting because we’re committed to providing independent, accessible journalism for all Nevadans.
But sustaining this work — informing communities, holding leaders accountable, and strengthening civic life — depends on readers like you.
Nevada needs strong, independent journalism. Will you join us?
A gift of any amount helps keep our reporting free and accessible to everyone across our state and funds our elections coverage.
Choose an amount or learn more about membership