Coronavirus Contextualized, 44th edition: Cases surpass 300,000 as vaccines administered crest 1 million

Welcome to the 44th installment of "Coronavirus Contextualized," a recurring feature in which we explore some of the numbers swirling around in the time of coronavirus.
Through these stories, we hope to parse the numbers, including confirmed cases of COVID-19, people tested, number of hospitalizations and deaths, and provide some context to them. You can view the prior editions of "Coronavirus Contextualized" here.
These stories serve as a written roundup of the COVID-19 trends we kept our eyes on this week, with all graphs and charts living permanently on our COVID-19 data page, where they are updated multiple times a day with the latest numbers.
We're continuing to take suggestions for what kind of data, graphs and trends you would like to see analyzed in future versions of this story or included in a future update of our data page. Reach out to [email protected] with any feedback.
Below, we take a look at the latest COVID-19 trends as many businesses were allowed to expand their capacity to 50 percent this week and as Gov. Steve Sisolak announced that all Nevadans 16 and older will be eligible for the vaccine starting April 5.
Cases and test positivity
The number of new COVID-19 cases reported each day in Nevada has remained at a relative plateau since late February.
As of Thursday, an average of 378 cases were reported each day over the last seven days, down slightly from 382 last week. Cases have been relatively steady for the last three weeks, fluctuating between a seven-day average of 340 and 460. (Several days in the last week saw elevated seven-day averages because of backlogged test results reported on March 12.)
At the peak of the surge this fall, the seven-day average was 2,736, on Dec. 10; the low point before cases started to increase in mid-September was 267.
State biostatistician Kyra Morgan, at a meeting of the COVID-19 Mitigation and Management Task Force this week, said that the state's vaccination effort likely played a role in how quickly cases dropped from the winter peak and the low level of cases currently being seen.
"Typically, we get worse faster than we recover," Morgan said. "We haven't seen that with this particular surge. Our numbers have improved really really quickly at the same kind of rate that they had declined or gotten worse. Vaccines are really the thing that's different in those two situations."
Since the beginning of the pandemic in March, there have been 300,483 COVID-19 cases reported statewide. Three percent of those cases, 10,508 have been diagnosed in the last month, and less than 1 percent, or 2,643 cases, have been reported in the last week.
One in 10 Nevadans has tested positive for the virus since the beginning of the pandemic.
Nevada's test positivity rate — which looks at the percentage of tests or people coming back positive out of the total tested — also continues to generally decline.
As usual, we'll look at two different methods of calculating test positivity below, using both individual people and a metric known as testing encounters.
Starting with the number of new reported people who tested positive for COVID-19 out of the total number of new reported people tested each day, the state's seven-day average test positivity rate was about 14.4 percent as of Thursday, down from 16.6 percent last week and significantly down from a high of 45.9 percent on Dec. 13. Before the fall surge, the test positivity rate was 9.2 percent.
One of the drawbacks, however, of looking at test positivity using individual people is that some people are tested repeatedly. Someone who tested negative four times but tested positive on their fifth time would be counted as a new positive person but not a new person tested. (In other words, they would be counted in the numerator but not the denominator.) That's why the test positivity rates calculated this way look so high.
Another way of looking at test positivity, as we have noted each week, is to examine test encounters, or the number of individual people tested each day. This method of looking at test positivity excludes duplicate samples collected the same day but accounts for people who are tested repeatedly on different days.
It is not possible to independently calculate the test positivity rate based on test encounters because the state only reports the number of positive cases, not the number of positive test encounters. However, the state does provide this number, calculated as an average over a 14-day period with a seven-day lag. As of Wednesday, that number was 5.2 percent, down from a high of 21.6 percent in mid-January and also less than the 6.1 percent test positivity rate the state saw in September before cases started to rise.
That test positivity rate is just right above the World Health Organization's target test positivity rate of 5 percent.
"These numbers are starting to stabilize," Morgan told the task force this week. "It could be that we hover right above that 5 percent goal."
Whichever method you use, the trend is still the same: Statewide test positivity continues to generally decline.
Since the beginning of the pandemic, about 1.5 million people — roughly 1 in 2 Nevadans — have been tested for COVID-19, and there have been about 2.9 million individual testing encounters.
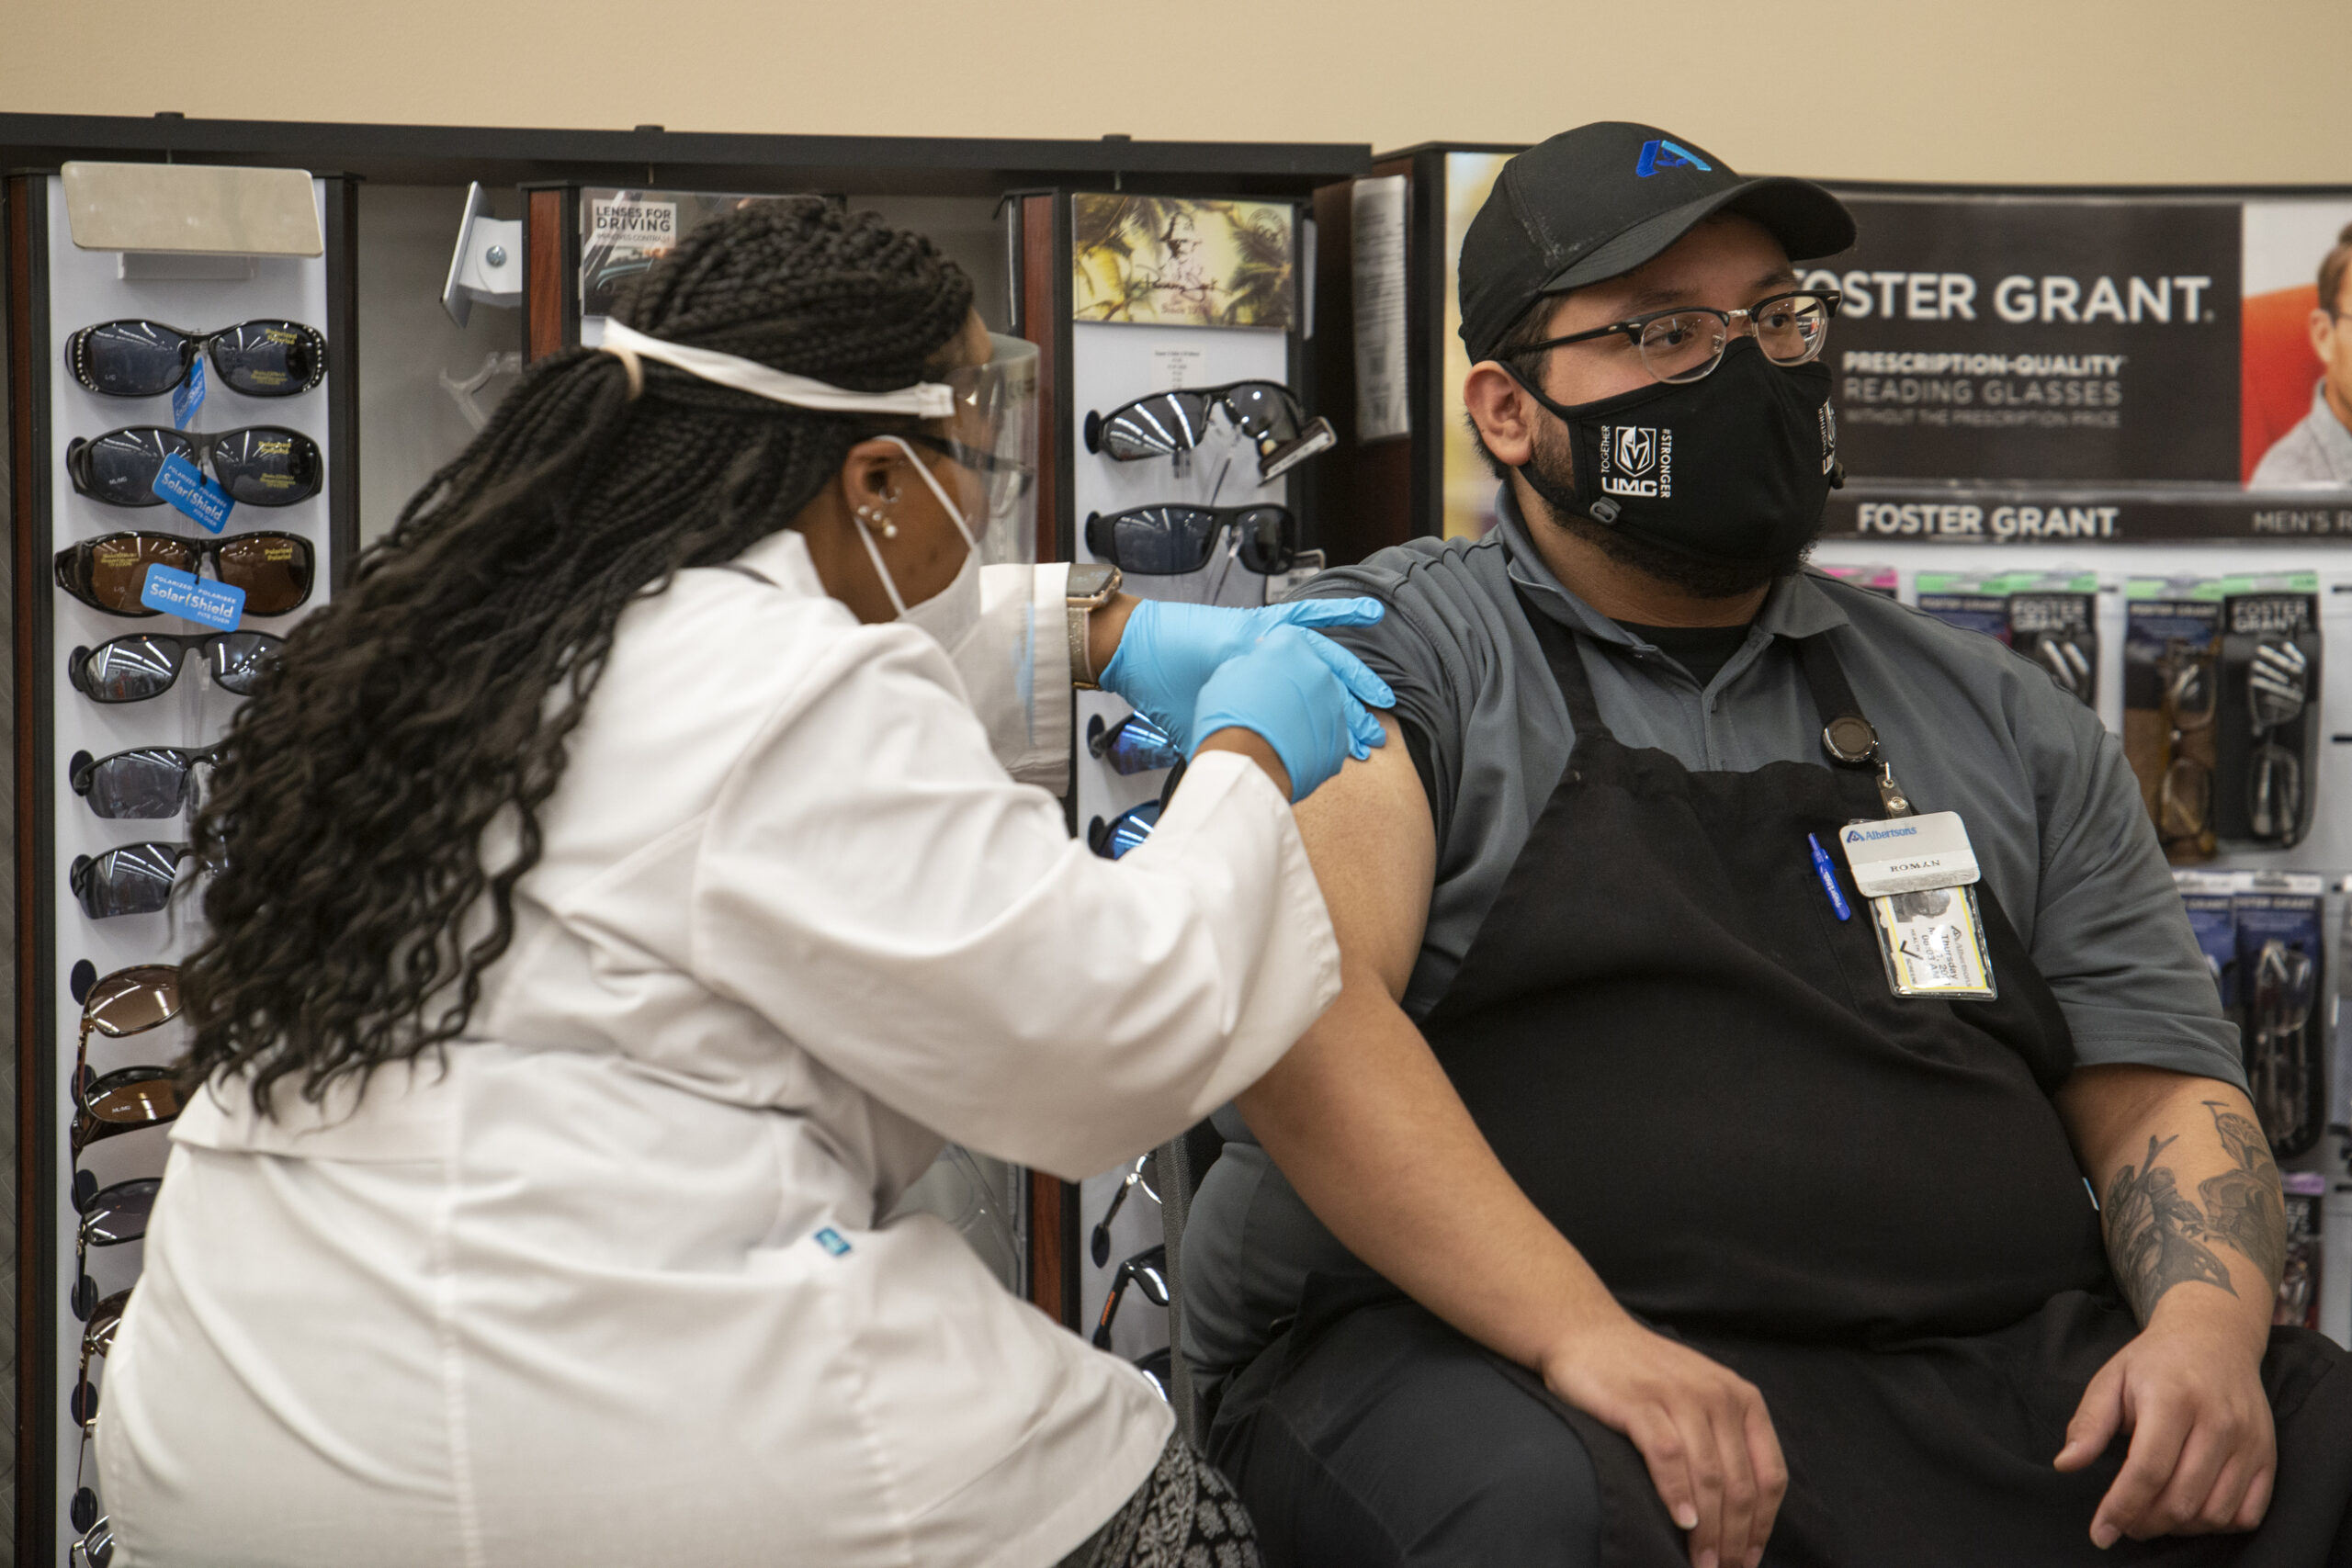
Vaccinations
More than 1 million doses of the COVID-19 vaccine have now been distributed statewide.
Since vaccinations started in December, 1,062,287 doses of the COVID-19 vaccine have been administered in Nevada, up from 904,504 last week. In total, 672,177 people have received at least one dose of the COVID-19 vaccine and 378,958 people have been fully vaccinated.
That means that nearly 22 percent of Nevadans have been either fully or partially vaccinated. In total, Nevada has received more than 1.3 million doses of the vaccine for distribution.
According to the CDC, Nevada has received the 7th fewest doses per capita of any state — the state was at 11th last week — at 42,987 per 100,000 residents. Alaska has received the most doses per capita at 69,582 per 100,000. The federal government has told state officials that it is using the 2018 American Community Survey population numbers, which may not accurately reflect Nevada's current population, to allocate doses to states.
Nevada has slightly improved in the national ranking of doses administered per capita by each state this week. It now stands at having administered the 32nd most doses, up from 33rd last week. Nevada also ranks 16th for doses administered as a percentage of doses received, at 80 percent.
Among the counties, White Pine County has now administered the most doses per capita, at about 6,500 vaccines administered per 10,000 residents, followed by Mineral County at 5,600 and Churchill at 3,800. Clark County continues to rank 9th at 3,200, while Washoe now ranks 6th, up from 8th, at 3,400. In this ranking, the Quad Counties — that is, Carson City and Douglas, Lyon and Storey counties — and Nye and Esmeralda counties are grouped together because they are coordinating vaccine distribution efforts.
It's also important to note that these numbers are a rough approximation, as shots are reported based on the county where they were administered, not where the person they were given to lives.
For more on the vaccination process in the state, read our vaccine Q&A here.
Deaths
The number of new COVID-19 deaths reported each day has started to plateau, though the level of deaths being seen each day is still much higher than it was at the last low point in October.
As of Thursday, 11 deaths were being reported on average each day over the last seven days, down from a high of 45 on Jan. 14 and essentially unchanged from last week. At the last low point on October 27, an average of 4 deaths were being seen each day.
Over the last seven days, 77 new COVID-19 deaths have been reported across the state, including:
- 68 in Clark County
- 6 in Washoe County
- 2 in Elko County
- 1 in Mineral County
Since the beginning of the pandemic, there have been 5,157 deaths from COVID-19. In the last month, 351 deaths from COVID-19 have been reported statewide, about 7 percent of the deaths reported statewide since the beginning of the pandemic.
Pershing County continues to have the highest number of deaths per capita in Nevada, with 30 deaths per 10,000 residents, followed by Carson City at 21 and Nye and Churchill counties, each at 20.
Hospitalizations
COVID-19 hospitalizations continue to remain relatively low statewide.
There were 331 people hospitalized with COVID-19 as of Wednesday, the last day for which data is available, down from 347 last week. For several days in the last week, the state saw record low hospitalizations, bottoming out at 298 hospitalizations on Saturday. The previous record low number of hospitalizations, 316, was reported on May 30.
"Declines in COVID-19 hospitalizations continue for the fourteenth straight week," the Nevada Hospital Association noted in its weekly report this week. "This downward trend started on or about December 17, 2020, and while the descent is slowing down, the numbers continue to shrink."
County by county
Two of the state's 17 counties, Douglas and Nye, are considered at elevated risk for the spread of COVID-19 according to state criteria as of Thursday.
Counties are considered at risk for elevated spread of COVID-19 if they meet two of the following three metrics:
- The average number of tests per day per 100,000, calculated over a 14-day period. If this number is less than 100, a county could be considered at risk.
- The case rate per 100,000, calculated by taking the number of cases diagnosed and reported over a 30-day period. If this number is greater than 200, a county could be considered at risk.
- The case rate per 100,000 and the test positivity rate, calculated over a 14-day period with a seven-day lag. If the case rate is greater than 50 and the test positivity rate is greater than 8.0 percent, a county could be considered at risk.
Nye County is flagged for a low test rate coupled with a too high test positivity rate, while Douglas County is flagged for a too high case and test positivity rate.
Carson City now has the highest case rate in the state at 334 cases per 100,000 residents in the last 30 days. Mineral County comes in second at 307 followed by Douglas County at 270. Four other counties — Washoe, Clark, Churchill and Lyon — have elevated case rates but are not flagged for elevated disease transmission because it is the only one of the three criteria they meet.
We’re looking out for Nevada — and for you
At The Nevada Independent, we spend our days monitoring government meetings so the public knows what’s happening behind the scenes, holding powerful institutions accountable, and helping you understand the issues that affect you.
In this critical election year, that mission is especially important.
In 2026, we’re closely watching state races, policy changes, and public accountability — so our community has accurate, trusted information when it matters most.
We’ve set a goal to raise $48,000 by April 24. Every gift moves us closer.
Will you step up and help us serve our community?
Choose an amount or learn more about membership