Coronavirus Contextualized, 43rd edition: Vaccinations continue as cases plateau, hospitalizations near lowest-ever point

Welcome to the 43rd installment of "Coronavirus Contextualized," a recurring feature in which we explore some of the numbers swirling around in the time of coronavirus.
Through these stories, we hope to parse the numbers, including confirmed cases of COVID-19, people tested, number of hospitalizations and deaths, and provide some context to them. You can view the prior editions of "Coronavirus Contextualized" here.
These stories serve as a written roundup of the COVID-19 trends we kept our eyes on this week, with all graphs and charts living permanently on our COVID-19 data page, where they are updated multiple times a day with the latest numbers.
We're continuing to take suggestions for what kind of data, graphs and trends you would like to see analyzed in future versions of this story or included in a future update of our data page. Reach out to [email protected] with any feedback.
Below, we take a look at the latest COVID-19 trends three days before health and safety restrictions loosen further on Monday as part of Gov. Steve Sisolak's 75-day reopening plan.
Cases and test positivity
The number of new COVID-19 cases reported each day in Nevada continues to remain relatively level.
As of Thursday, an average of 382 cases were reported each day over the last seven days, just slightly up from 346 last week. Cases have been relatively steady for the last three weeks, fluctuating between a seven-day average of 340 and 410.
At the peak of the surge this fall, the seven-day average was 2,736, on Dec. 10; the low point before cases started to increase in mid-September was 267.
Since the beginning of the pandemic in March, there have been 297,840 COVID-19 cases reported statewide. Four percent of those cases, 11,307 have been diagnosed in the last month, and less than 1 percent, or 2,673 cases, have been reported in the last week.
One in 10 Nevadans has tested positive for the virus since the beginning of the pandemic.
Nevada's test positivity rate — which looks at the percentage of tests or people coming back positive out of the total tested — also continues to generally decline.
As usual, we'll look at two different methods of calculating test positivity below, using both individual people and a metric known as testing encounters.
Starting with the number of new reported people who tested positive for COVID-19 out of the total number of new reported people tested each day, the state's seven-day average test positivity rate was about 16.6 percent as of Thursday, down from 19.8 percent last week and significantly down from a high of 45.9 percent on Dec. 13. Before the fall surge, the test positivity rate was 9.2 percent.
One of the drawbacks, however, of looking at test positivity using individual people is that some people are tested repeatedly. Someone who tested negative four times but tested positive on their fifth time would be counted as a new positive person but not a new person tested. (In other words, they would be counted in the numerator but not the denominator.) That's why the test positivity rates calculated this way look so high.
Another way of looking at test positivity, as we have noted each week, is to examine test encounters, or the number of individual people tested each day. This method of looking at test positivity excludes duplicate samples collected the same day but accounts for people who are tested repeatedly on different days.
It is not possible to independently calculate the test positivity rate based on test encounters because the state only reports the number of positive cases, not the number of positive test encounters. However, the state does provide this number, calculated as an average over a 14-day period with a seven-day lag. As of Wednesday, that number was 6.0 percent, down from a high of 21.6 percent in mid-January and finally less than the 6.2 percent test positivity rate from September before cases started to rise.
Whichever method you use, the trend, generally, is still the same: Statewide test positivity continues to be on an overall decline.
Since the beginning of the pandemic, about 1.4 million people — about 1 in 2 Nevadans — have been tested for COVID-19, and there have been more than 2.8 million individual testing encounters.
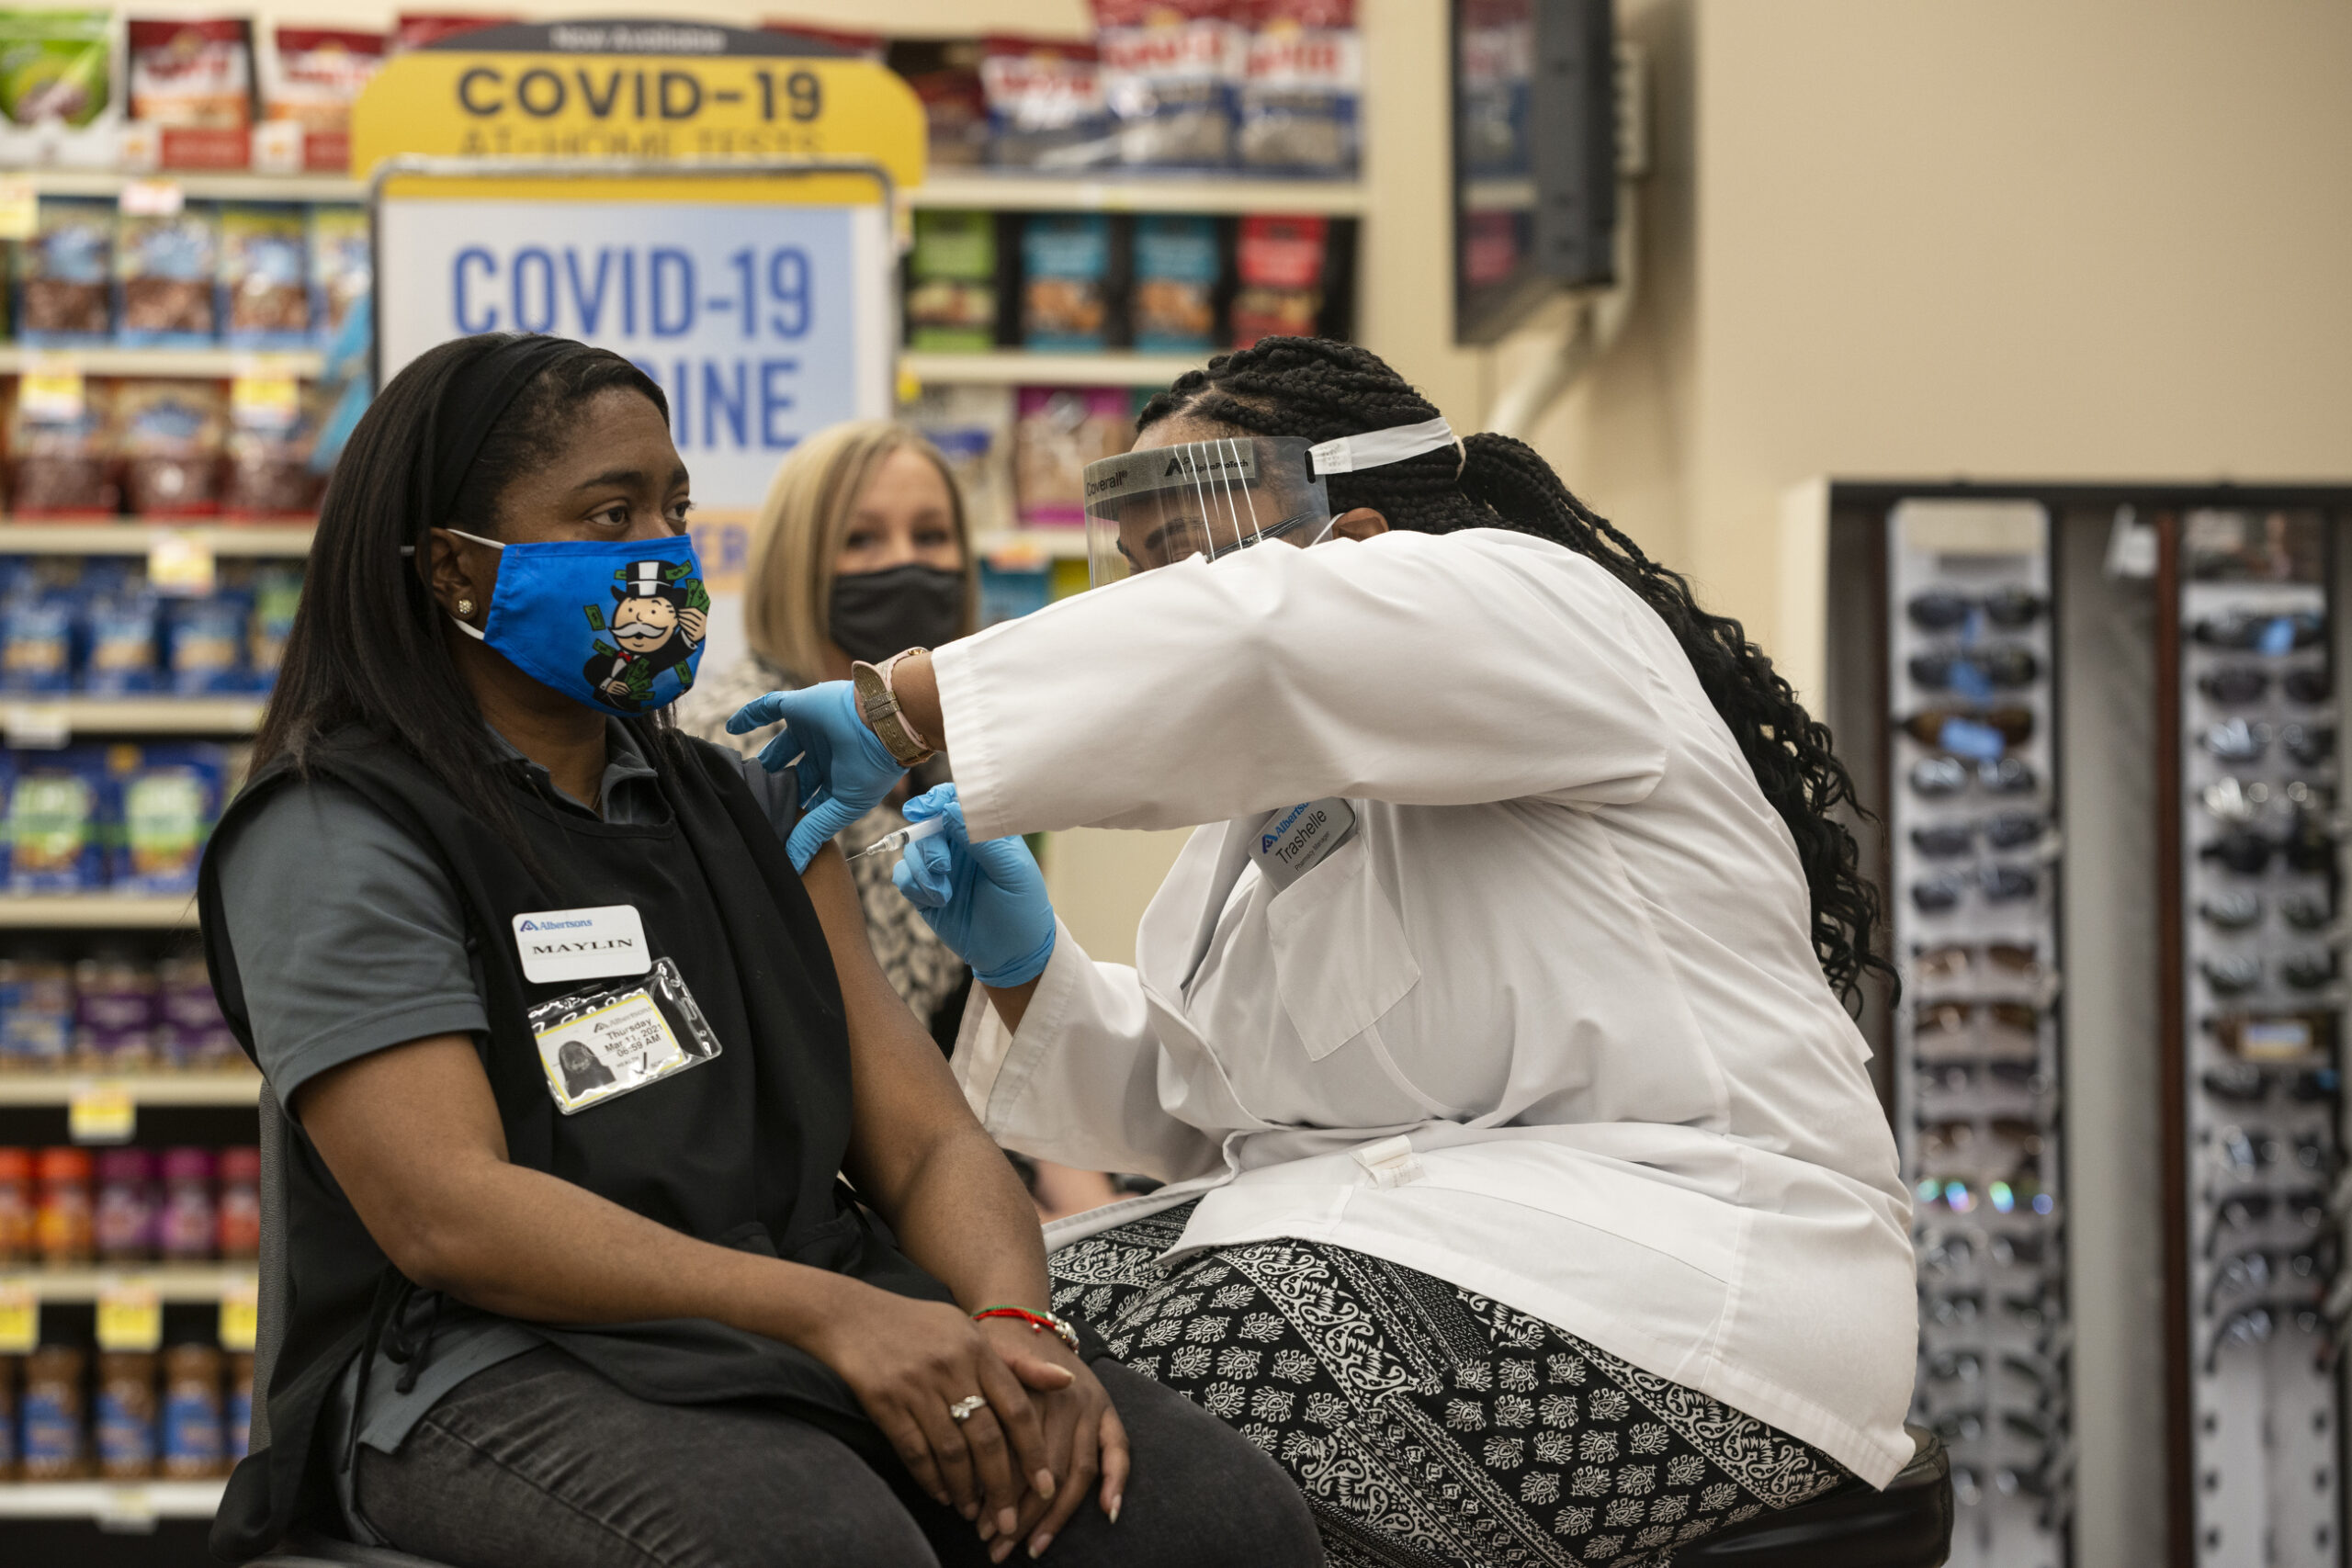
Vaccinations
Since vaccinations started in December, 904,504 doses of the COVID-19 vaccine have been administered in Nevada, up from 750,160 last week. In total, 568,912 people have received at least one dose of the COVID-19 vaccine and 316,682 people have been fully vaccinated.
That means that 1 in 5 Nevadans has either been fully or partially vaccinated. In total, Nevada has been distributed nearly 1.2 million doses of the vaccine by the federal government.
According to the CDC, Nevada has received the 11th fewest number of doses per capita from the federal government of any state — the state was at 13th last week — at 37,705 per 100,000 residents. Alaska has received the most doses per capita at 63,274 per 100,000. The federal government has told state officials that it is using the 2018 American Community Survey population numbers, which may not accurately reflect Nevada's current population, to allocate doses to states.
Nevada improved in the national ranking of doses administered per capita by each state this week. It now stands at having administered the 33rd most doses, up from 37th last week. Nevada also ranks 19th for doses administered as a percentage of doses received, at 78 percent.
Among the counties, Mineral County has still administered the most doses per capita, at about 5,200 vaccines administered per 10,000 residents, followed by White Pine at 4,000 and Eureka at 3,300. Clark County continues to rank 9th at 2,700, while Washoe now ranks 8th, down from 7th, at 3,000. In this ranking, the Quad Counties — that is, Carson City, Douglas, Lyon and Storey counties — and Nye and Esmeralda counties are grouped together because they are coordinating vaccine distribution efforts.
It's also important to note that these numbers are a rough approximation, as shots are reported based on the county where they were administered, not where the person they were given to lives.
For more on the vaccination process in the state, read our vaccine Q&A here.
Deaths
Deaths from COVID-19 continue to remain far below what they were several weeks ago, though the last week has seen a generally stagnating number of new daily deaths reported each day.
As of Thursday, 11 deaths were being reported on average each day over the last seven days, down from a high of 45 on Jan. 14 but slightly up from 10 last week. Over the last seven days, 75 new COVID-19 deaths have been reported across the state, including:
- 68 in Clark County
- 5 in Washoe County
- 1 in each Carson City and Nye County
In the last month, 441 deaths from COVID-19 have been reported statewide, about 9 percent of the deaths reported statewide since the beginning of the pandemic.
Pershing County has the highest number of deaths per capita in Nevada, with 30 deaths per 10,000 residents, followed by Carson City at 21 and Nye and Churchill counties, each at 20.
Hospitalizations
COVID-19 hospitalizations in Nevada not only continue to decline across the state but are nearing the state's record low for hospitalizations set in May before Nevada started reopening businesses.
There were 347 people hospitalized with COVID-19 as of Wednesday, the last day for which data is available, down from 407 last week. The record, 2,025 hospitalizations, was set on Dec. 13. The last low point in September was 417. The lowest they have ever been since the beginning of the pandemic was 316, on May 30.
County by county
Only one of the state's 17 counties, Nye County, is considered at elevated risk for the spread of COVID-19 according to state criteria as of Thursday.
Counties are considered at risk for elevated spread of COVID-19 if they meet two of the following three metrics:
- The average number of tests per day per 100,000, calculated over a 14-day period. If this number is less than 100, a county could be considered at risk.
- The case rate per 100,000, calculated by taking the number of cases diagnosed and reported over a 30-day period. If this number is greater than 200, a county could be considered at risk.
- The case rate per 100,000 and the test positivity rate, calculated over a 14-day period with a seven-day lag. If the case rate is greater than 50 and the test positivity rate is greater than 8.0 percent, a county could be considered at risk.
Mineral County continues to have the highest case rate in the state at 417 cases per 100,000 residents in the last 30 days. Carson City comes in second at 361 and Clark County comes in third at 326. Nine counties have elevated case rates but are not flagged for elevated disease transmission because it is the only one of the three criteria they meet.
Nye County is not flagged for a high case rate but rather a low number of tests and a too high test positivity rate.
Support Local Journalism
You’ve enjoyed unlimited access to our reporting because we’re committed to providing independent, accessible journalism for all Nevadans.
But sustaining this work — informing communities, holding leaders accountable, and strengthening civic life — depends on readers like you.
Nevada needs strong, independent journalism. Will you join us?
A gift of any amount helps keep our reporting free and accessible to everyone across our state.
Choose an amount or learn more about membership